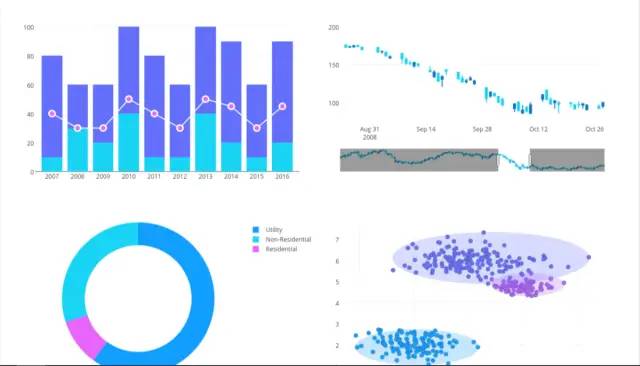
可能是最强的Python可视化神器,建议一试
1. Plotly

from plotly.graph_objs import Scatter,Layout
import plotly
import plotly.offline as py
import numpy as np
import plotly.graph_objs as go
#setting offilne 离线模式
plotly.offline.init_notebook_mode(connected=True)
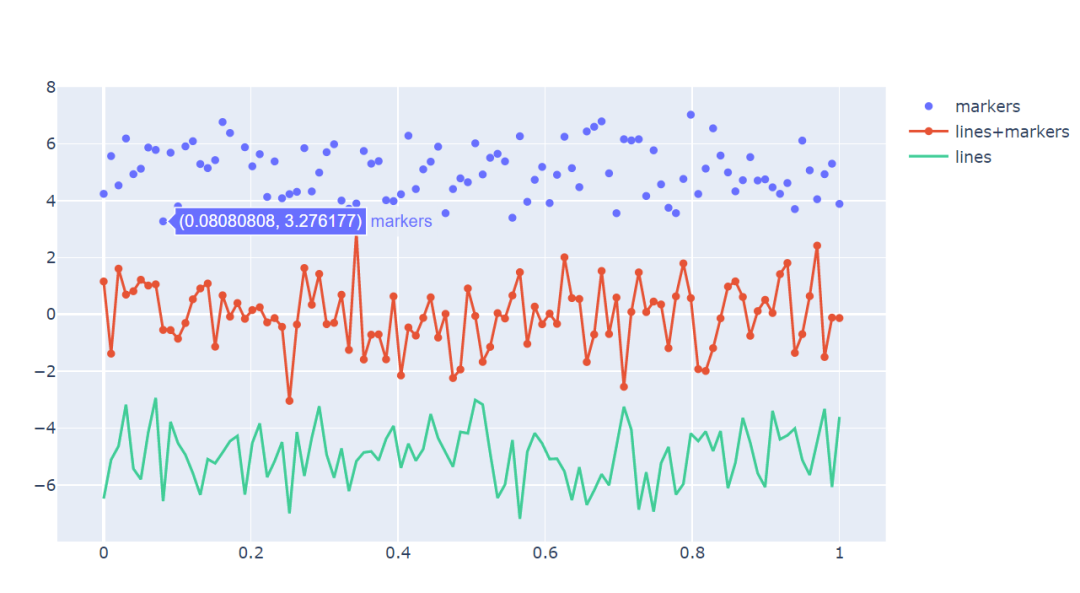
2. 制作折线图
N = 100
random_x = np.linspace(0,1,N)
random_y0 = np.random.randn(N)+5
random_y1 = np.random.randn(N)
random_y2 = np.random.randn(N)-5

#Create traces
trace0 = go.Scatter(
    x = random_x,
    y = random_y0,
    mode = 'markers',
    name = 'markers'
)
trace1 = go.Scatter(
    x = random_x,
    y = random_y1,
    mode = 'lines+markers',
    name = 'lines+markers'
)
trace2 = go.Scatter(
    x = random_x,
    y = random_y2,
    mode = 'lines',
    name = 'lines'
)
data = [trace0,trace1,trace2]
py.iplot(data)

绘制的图片系统默认配色也挺好看的~
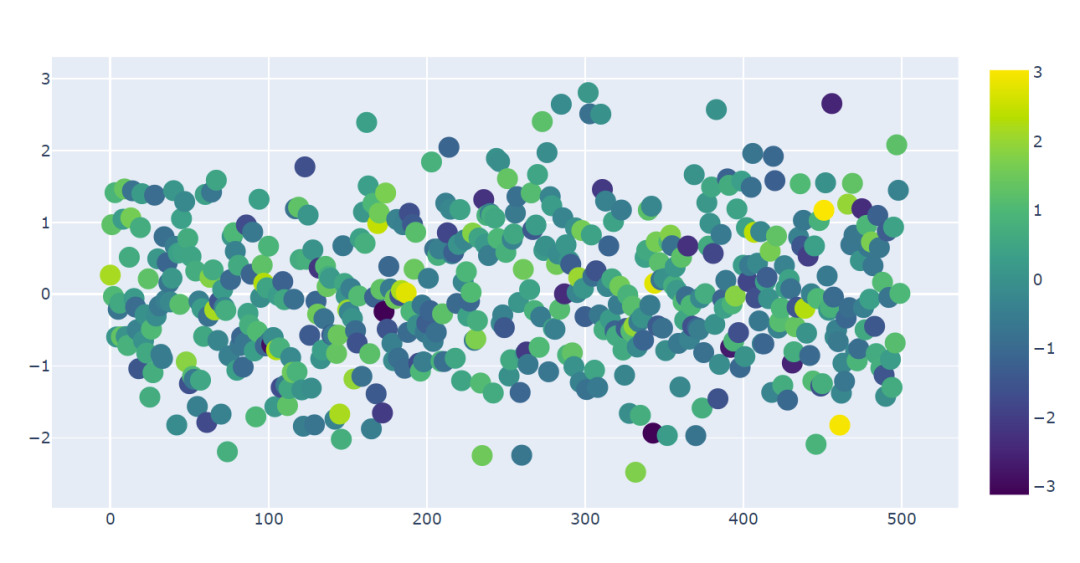
3. 制作散点图
trace1 = go.Scatter(
     y = np.random.randn(500),
    mode = 'markers',
    marker = dict(
        size = 16,
        color = np.random.randn(500),
        colorscale = 'Viridis',
        showscale = True
    )
)
data = [trace1]
py.iplot(data)

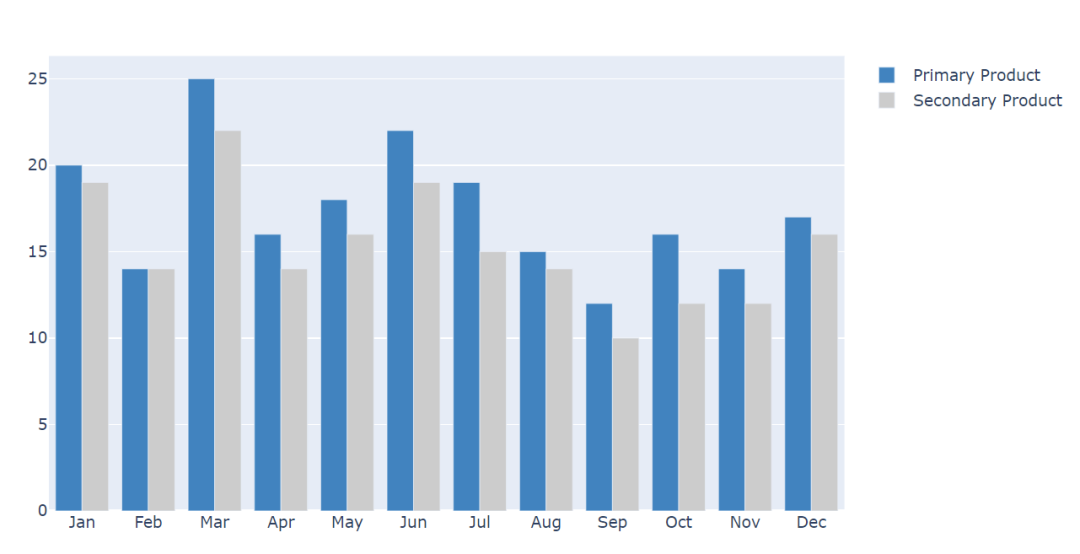
4. 直方图
trace0 = go.Bar(
    x = ['Jan','Feb','Mar','Apr', 'May','Jun',
         'Jul','Aug','Sep','Oct','Nov','Dec'],
    y = [20,14,25,16,18,22,19,15,12,16,14,17],
    name = 'Primary Product',
    marker=dict(
        color = 'rgb(49,130,189)'
    )
)
trace1 = go.Bar(
    x = ['Jan','Feb','Mar','Apr', 'May','Jun',
         'Jul','Aug','Sep','Oct','Nov','Dec'],
    y = [19,14,22,14,16,19,15,14,10,12,12,16],
    name = 'Secondary Product',
    marker=dict(
        color = 'rgb(204,204,204)'
    )
)
data = [trace0,trace1]
py.iplot(data)
推荐阅读:
入门: 最全的零基础学Python的问题 | 零基础学了8个月的Python | 实战项目 |学Python就是这条捷径
干货:爬取豆瓣短评,电影《后来的我们》 | 38年NBA最佳球员分析 | 从万众期待到口碑扑街!唐探3令人失望 | 笑看新倚天屠龙记 | 灯谜答题王 |用Python做个海量小姐姐素描图 |碟中谍这么火,我用机器学习做个迷你推荐系统电影
趣味:弹球游戏 | 九宫格 | 漂亮的花 | 两百行Python《天天酷跑》游戏!
AI: 会做诗的机器人 | 给图片上色 | 预测收入 | 碟中谍这么火,我用机器学习做个迷你推荐系统电影
小工具: Pdf转Word,轻松搞定表格和水印! | 一键把html网页保存为pdf!| 再见PDF提取收费! | 用90行代码打造最强PDF转换器,word、PPT、excel、markdown、html一键转换 | 制作一款钉钉低价机票提示器! |60行代码做了一个语音壁纸切换器天天看小姐姐!|
年度爆款文案
点阅读原文,看200个Python案例!
评论


