
Python数学建模系列(八):图论
1 图论模型 - Dijkstra
Dijkstra算法能求一个顶点到另一顶点最短路径。
基础概念
无向图:若图中的每条边都是没有方向的,则称该图为无向图。 有向图:若图中的每条边都是有方向的,则称该图为有向图。 混合图:若图中的部分边是有方向的,而部分边是无方向的,则称该图为混合图。
样例1
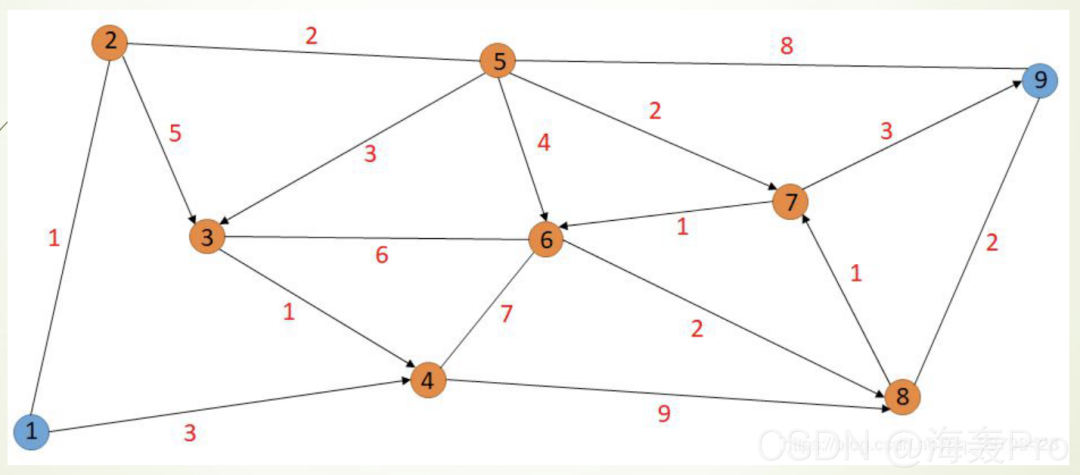
如下图所示,我们需要从①点走到⑨点,每条边的红色数 字代表这条边的长度,我们如何找到①到⑨的最短路径呢?
步骤:
将①标记为P,其它标记为T,找出从①出发当前最短的边所到的点,将该点的T改为P 将所有P点找到可以到达的T标记点上最短的边,将到达的点T改为P 重复步骤,指导终点的T变为P
过程展示:圈加数字代表每个顶点,()内数字代表当前行走的距离
❝1.①(0)
2.①②(1)
3.①②⑤(3)
4.①②⑤(3) ①④(3)
5.①②⑤⑦(5) ①④(3)
6.①②⑤⑦⑥(6) ①④(3)
7.①②⑤⑦⑥(6) ①②⑤③(6) ①④(3)
8.①②⑤⑦⑥(6) ①②⑤③④(7) ①④(3)
9.①②⑤⑦⑥⑧(8) ①②⑤③④(7) ①④(3)
10.①②⑤⑦⑥⑧(8) ①②⑤⑦⑨(8) ①②⑤③④(7) ①④(3)
❞
「所以最短的路径是 ① ② ⑤ ⑦ ⑨, 长度为8」
带权邻接矩阵:带权邻接矩阵是表示顶点相邻关系的矩阵,例如上面那个图的带权邻接矩阵如下

❝注意:原PPT中有错误,
❞点9 -> 点7 应该为inf(上图已经修改)
每个点和自己的距离为0(主对角线上元素都是零)
在图上相邻两个点的如果是连通的,距离就是矩阵的值,无向 的关于主对角线对称;有向的只有可以过去的路有数值
无法连通的距离就是无穷,记为inf
Demo代码
# 运行环境:Vs Code
# PPT中代码有点错误 已经修改~
# 以下代码经测试 可行
from collections import defaultdict
from heapq import *
inf = 99999 # 不连通值
mtx_graph = [[0, 1, inf, 3, inf, inf, inf, inf, inf],
             [1, 0, 5, inf, 2, inf, inf, inf, inf],
             [inf, inf, 0, 1, inf, 6, inf, inf, inf],
             [inf, inf, inf, 0, inf, 7, inf, 9, inf],
             [inf, 2, 3, inf, 0, 4, 2, inf, 8],
             [inf, inf, 6, 7, inf, 0, inf, 2, inf],
             [inf, inf, inf, inf, inf, 1, 0, inf, 3],
             [inf, inf, inf, inf, inf, inf, 1, 0, 2],
             [inf, inf, inf, inf, 8, inf, inf, 2, 0]]
m_n = len(mtx_graph)#带权连接矩阵的阶数
edges = [] #保存连通的两个点之间的距离(点A、点B、距离)
for i in range(m_n):
    for j in range(m_n):
        if i!=j and mtx_graph[i][j]!=inf:
            edges.append((i,j,mtx_graph[i][j]))

def dijkstra(edges, from_node, to_node):
    go_path = []
    to_node = to_node-1
    g = defaultdict(list)
    for l,r,c in edges:
        # l:点A r:点B c:距离
        # 字典: 点A -> (距离,点B)
        g[l].append((c,r))
    q, seen = [(0, from_node-1, ())], set()
    while q:
        (cost, v1, path) = heappop(q)#堆弹出当前路径最小成本
        if v1 not in seen:
            seen.add(v1)
            path = (v1, path)
            if v1 == to_node:
                break
            for c, v2 in g.get(v1, ()):
                if v2 not in seen:
                    heappush(q, (cost+c, v2, path))

    if v1!=to_node:   #无法到达
        return float('inf'), []
    if len(path)>0:
        left=path[0]
        go_path.append(left)
        right=path[1]
        while len(right)>0:
            left=right[0]
            go_path.append(left)
            right=right[1]

        go_path.reverse() #逆序变换
        for i in range(len(go_path)): #标号加1
            go_path[i]=go_path[i]+1
    return cost, go_path
leght, path = dijkstra(edges, 1, 9)
print('最短距离为:'+str(leght))
print('前进路径为:'+str(path))
运行结果
最短距离为:8
前进路径为:[1, 2, 5, 7, 9]

2 图论模型-Floyd
Floyd算法通过动态规划解决任意两点间的最短路径(多源最短路径)的问题,「可以正确处理负权的最短路径问题」
关键原理:
❝枚举中间点k,找到最小的,作为的最小值
❞
关键结论:
❝假设i和j之间的最短路径上的结点集里(不包含i,j),编号最大的一个是x.那么在外循环k = x时, 肯定得到了最小值.
❞
强归纳法 :
❝设i到x中间编号最大的是x1,x到j中间编号最大的是x2.由于x是i到j中间编号最大的,那么显然
❞
根据结论,时候已经取得最小值,时候已经取得最
小值
那么时,和已经都取得最小值.
因此时,执行
样例2
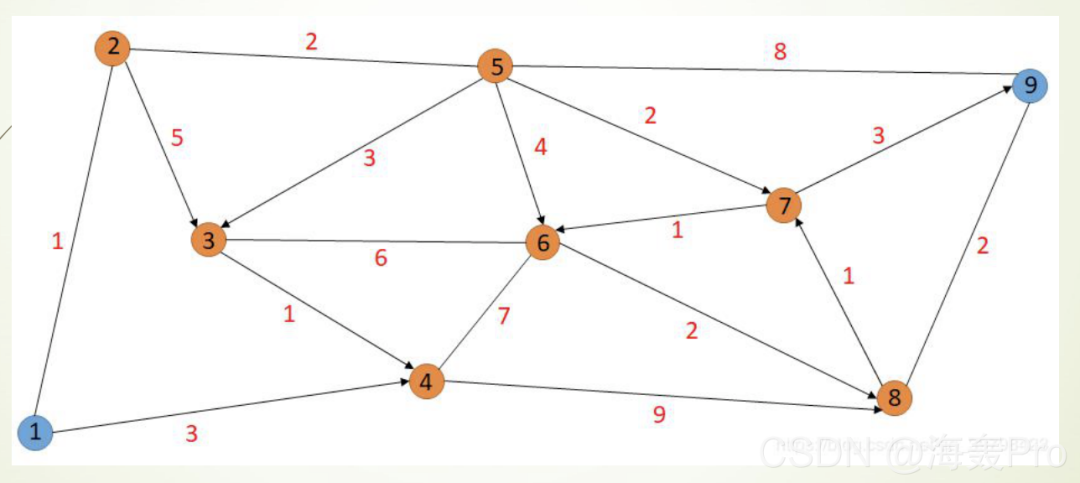
与样例1相似,只是这次我们「求出从每一个点到其他点的最短距离和路径」,每条边的红色数字代表这条边的长度。
Demo代码
from collections import defaultdict
from heapq import *
import numpy as np
inf = 99999 # 不连通值
mtx_graph = [[0, 1, inf, 3, inf, inf, inf, inf, inf],
             [1, 0, 5, inf, 2, inf, inf, inf, inf],
             [inf, inf, 0, 1, inf, 6, inf, inf, inf],
             [inf, inf, inf, 0, inf, 7, inf, 9, inf],
             [inf, 2, 3, inf, 0, 4, 2, inf, 8],
             [inf, inf, 6, 7, inf, 0, inf, 2, inf],
             [inf, inf, inf, inf, inf, 1, 0, inf, 3],
             [inf, inf, inf, inf, inf, inf, 1, 0, 2],
             [inf, inf, inf, inf, 8, inf, inf, 2, 0]]
def Floyd(graph):
    N=len(graph)
    A=np.array(graph)
    path=np.zeros((N,N))
    for i in range(0,N):
        for j in range(0,N):
            if A[i][j]!=inf:
                path[i][j]=j
    for k in range(0,N):
        for i in range(0,N):
            for j in range(0,N):
                # 原PPT这一句代码有错 写成了 A[i][j]+A[k][j]<A[i][j]
                # 正确应该是:A[i][k]+A[k][j]<A[i][j]
                if A[i][k]+A[k][j]<A[i][j]:
                    A[i][j]=A[i][k]+A[k][j]
                    path[i][j]=path[i][k]
    for i in range(0,N):
        for j in range(0,N):
            path[i][j]=path[i][j]+1
    print('距离 = ')
    print(A)
    print('路径 = ')
    print(path)

Floyd(mtx_graph)
运行结果
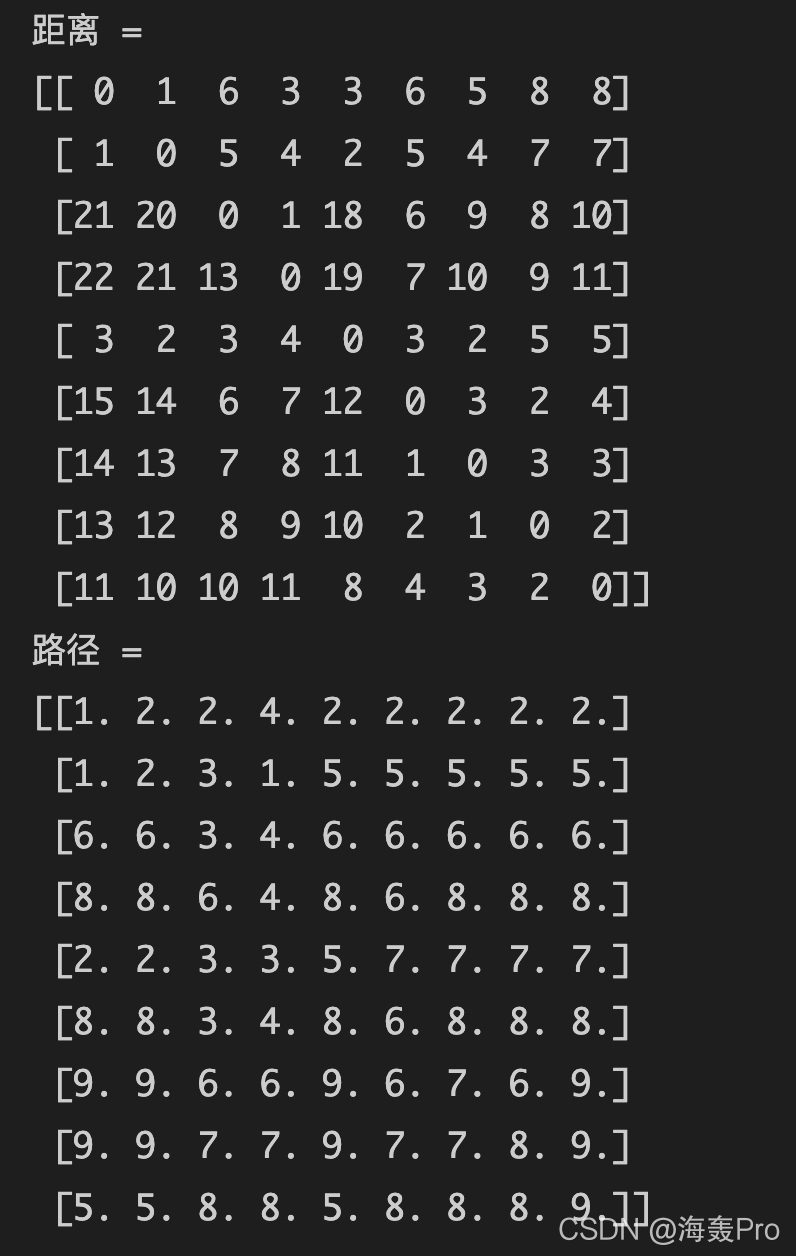
❝注意:原PPT 结果中 最后一行有错 应该是
❞5. 5. 8. 8. 5. 8. 8. 8. 9.PPT中是:5. 5. 7.7. 5. 7. 7. 8. 9.因为在最初的mtx_graph设置就错了:点9到点7 应该是inf 而不是 3
结论:
从点1 到 点9 的距离为8(结果中“距离”矩阵中第一行第九列数值) 路径为【1 - 2 - 5 - 7 - 9】
怎么看路径呢?
从最后结果中查看”路径“矩阵 点1 到 点9 首先看第一行第九列 数值为2 这是中间位置2,再看第二行第九列,数值为5 再看第五行第九列,数值为7 再看第七行第九列,数值为9 得到最终路径【1 - 2 - 5 - 7 - 9】

3 机场航线设计
数据集来自航空业,有一些关于航线的基本信息。有某段旅程的起始点和目的地。还有一些列表示每段旅程的到达和起飞时间。这个数据集非常适合作为图进行分析。想象一下通过航线(边)连接的几个城市(节点)。
如果你是航空公司,你可以问如下几个问题:
从A到B的最短途径是什么?分别从距离和时间角度考虑。 有没有办法从C到D? 哪些机场的交通最繁忙? 哪个机场位于大多数其他机场“之间”?这样它就可以变成当地的一个中转站。
0、Airlines.csv数据
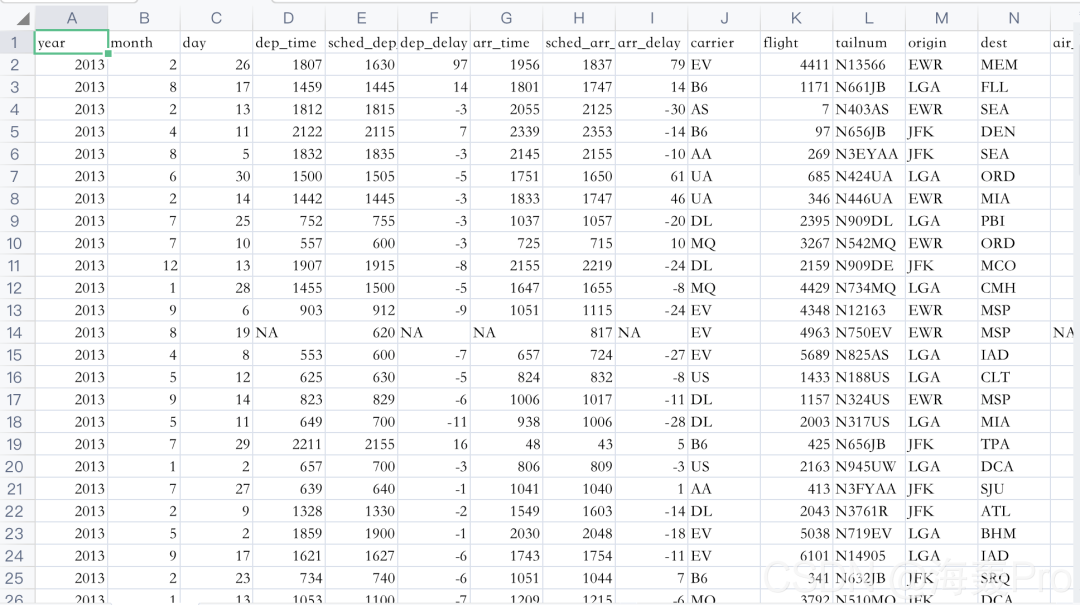
1、数据导入、观察变量
import numpy as np
import pandas as pd
data = pd.read_csv('../Profile/Airlines.csv')
data.shape #数据大小

# (100, 16) 100行16列
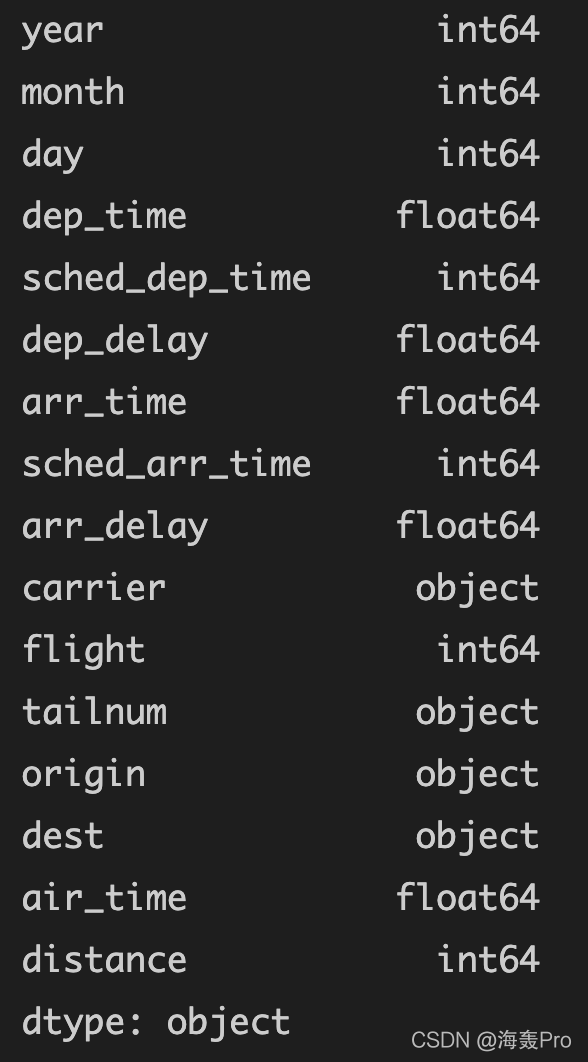
运行结果 「查看各个变量的类型」
data.dtypes # 各变量的类型
运行结果
2、数据清洗
#将sched_dep_time转换为'std'—预定的出发时间
data['std'] = data.sched_dep_time.astype(str).str.replace('(\d{2}$)', '') + ':' + data.sched_dep_time.astype(str).str.extract('(\d{2}$)', expand=False) + ':00'

#将sched_arr_time转换为“sta”—预定到达时间
data['sta'] = data.sched_arr_time.astype(str).str.replace('(\d{2}$)', '') + ':' + data.sched_arr_time.astype(str).str.extract('(\d{2}$)', expand=False) + ':00'

#将dep_time转换为'atd' -实际出发时间
data['atd'] = data.dep_time.fillna(0).astype(np.int64).astype(str).str.replace('(\d{2}$)', '') + ':' + data.dep_time.fillna(0).astype(np.int64).astype(str).str.extract('(\d{2}$)', expand=False) + ':00'

#将arr_time转换为'ata' -实际到达时间
data['ata'] = data.arr_time.fillna(0).astype(np.int64).astype(str).str.replace('(\d{2}$)', '') + ':' + data.arr_time.fillna(0).astype(np.int64).astype(str).str.extract('(\d{2}$)', expand=False) + ':00'
3、时间信息合并
data['date'] = pd.to_datetime(data[['year', 'month', 'day']])
data = data.drop(columns = ['year', 'month', 'day'])
4、创建图
import networkx as nx

FG = nx.from_pandas_edgelist(data, source='origin', target='dest', edge_attr=True,)
# 查看所有节点
FG.nodes()
运行结果
#NodeView(('EWR', 'MEM', 'LGA', 'FLL', 'SEA', 'JFK', 'DEN', 'ORD', 'MIA', 'PBI', 'MCO', 'CMH', 'MSP', 'IAD', 'CLT', 'TPA', 'DCA', 'SJU', 'ATL', 'BHM', 'SRQ', 'MSY', 'DTW', 'LAX', 'JAX', 'RDU', 'MDW', 'DFW', 'IAH', 'SFO', 'STL', 'CVG', 'IND', 'RSW', 'BOS', 'CLE'))
 「查询图中的所有边」
# 查看所有边
FG.edges()
运行结果
#EdgeView([('EWR', 'MEM'), ('EWR', 'SEA'), ('EWR', 'MIA'), ('EWR', 'ORD'), ('EWR', 'MSP'), ('EWR', 'TPA'), ('EWR', 'MSY'), ('EWR', 'DFW'), ('EWR', 'IAH'), ('EWR', 'SFO'), ('EWR', 'CVG'), ('EWR', 'IND'), ('EWR', 'RDU'), ('EWR', 'IAD'), ('EWR', 'RSW'), ('EWR', 'BOS'), ('EWR', 'PBI'), ('EWR', 'LAX'), ('EWR', 'MCO'), ('EWR', 'SJU'), ('LGA', 'FLL'), ('LGA', 'ORD'), ('LGA', 'PBI'), ('LGA', 'CMH'), ('LGA', 'IAD'), ('LGA', 'CLT'), ('LGA', 'MIA'), ('LGA', 'DCA'), ('LGA', 'BHM'), ('LGA', 'RDU'), ('LGA', 'ATL'), ('LGA', 'TPA'), ('LGA', 'MDW'), ('LGA', 'DEN'), ('LGA', 'MSP'), ('LGA', 'DTW'), ('LGA', 'STL'), ('LGA', 'MCO'), ('LGA', 'CVG'), ('LGA', 'IAH'), ('FLL', 'JFK'), ('SEA', 'JFK'), ('JFK', 'DEN'), ('JFK', 'MCO'), ('JFK', 'TPA'), ('JFK', 'SJU'), ('JFK', 'ATL'), ('JFK', 'SRQ'), ('JFK', 'DCA'), ('JFK', 'DTW'), ('JFK', 'LAX'), ('JFK', 'JAX'), ('JFK', 'CLT'), ('JFK', 'PBI'), ('JFK', 'CLE'), ('JFK', 'IAD'), ('JFK', 'BOS')])

「计算图的平均边密度」
#注意我们的100行数据都来自3个机场
nx.draw_networkx(FG, with_labels=True)
nx.algorithms.degree_centrality(FG)

# 图的平均边密度
nx.density(FG)

# 0.09047619047619047
运行结果(对图进行可视化) 「求图中所有路径的平均最短路径长度」
#图中所有路径的平均最短路径长度
nx.average_shortest_path_length(FG)

# 2.36984126984127
运行结果
 「对于一个度为k的节点-求的邻居度的平均值」
#对于一个度为k的节点-它的邻居度的平均值是多少
nx.average_degree_connectivity(FG) # For a node of degree k - What is the average of its neighbours' degree?

#{20: 1.95, 1: 19.307692307692307, 2: 19.0625, 17: 2.0588235294117645, 3: 19.0}
运行结果

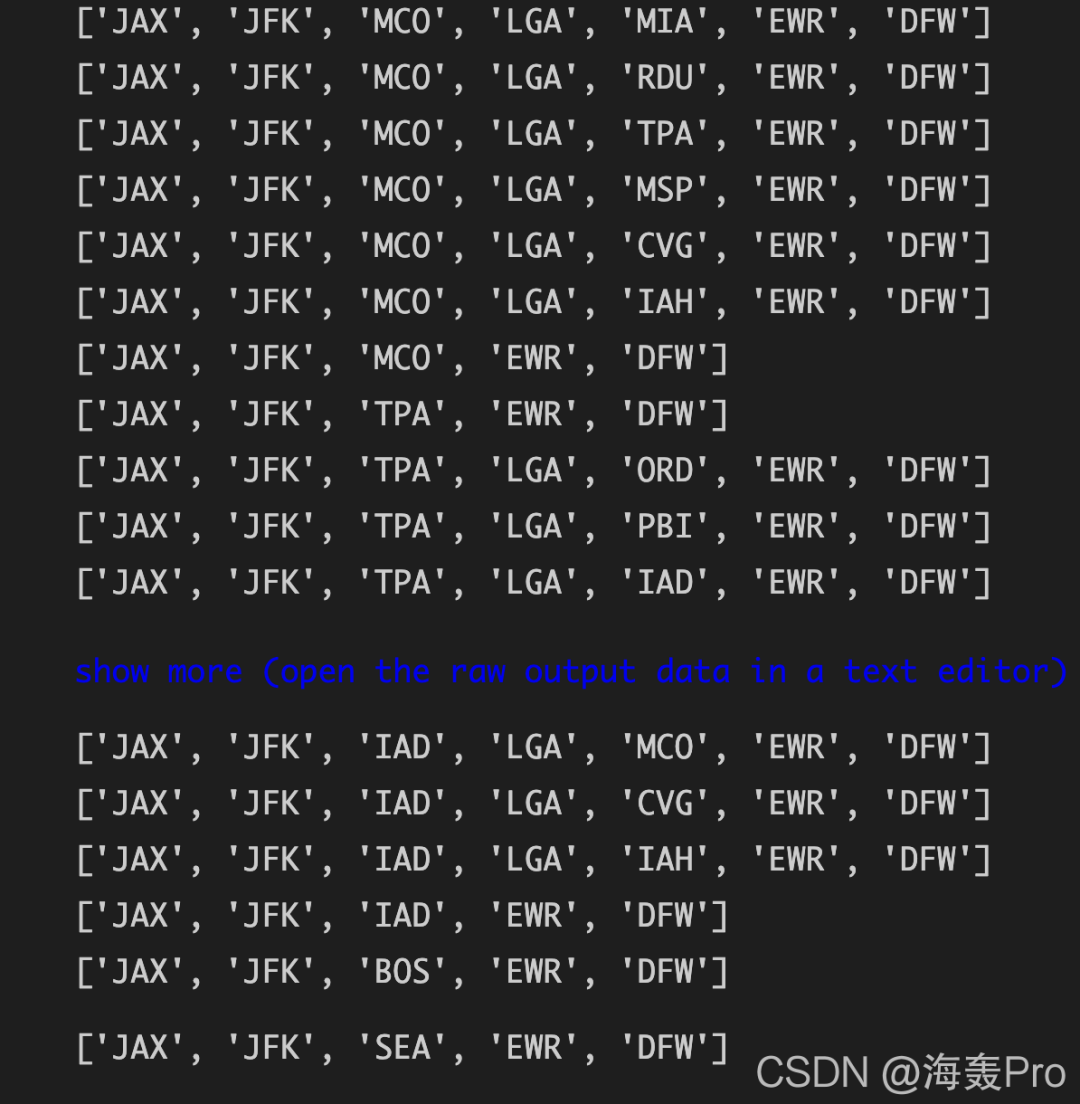
5、计算航线
# 找出所有 JAX 到 DFW 的航线
for path in nx.all_simple_paths(FG, source='JAX', target='DFW'):
    print(path)

#找出从JAX到DFW的dijkstra路径。
dijpath = nx.dijkstra_path(FG, source='JAX', target='DFW')
dijpath # ['JAX', 'JFK', 'SEA', 'EWR', 'DFW'] 下图中的最后一行
运行结果
 「从所有航线中找出 飞行时间最短的路径」
# 从所有航线中找出 飞行时间最短的路径
shortpath = nx.dijkstra_path(FG, source='JAX', target='DFW', weight='air_time')
shortpath
# ['JAX', 'JFK', 'BOS', 'EWR', 'DFW']
运行结果:
 注意事项
注意事项
起始点和目的地可以作为节点,其他信息应当作为节点或边属性;单条边可以被认为是一段旅程。这样的旅程将有不同的时间,航班号,飞机尾号等相关信息。 注意到年,月,日和时间信息分散在许多列;想创建一 个包含所有这些信息的日期时间列,还需要将预计的 (scheduled)和实际的(actual)到达离开时间分开;最终 应该有4个日期时间列(预计到达时间、预计起飞时间、 实际到达时间和实际起飞时间) 时间格式问题 数据类型问题 NaN值的麻烦
结语
学习来源:B站及其课堂PPT,对其中代码进行了复现
❝https://www.bilibili.com/video/BV12h411d7Dm
PPT中错误有点多 用了挺久的时间学习原理找错误 哎~
以上代码均已运行成功!环境:Vs Code
❞
「文章仅作为学习笔记,记录从0到1的一个过程」
希望对您有所帮助,如有错误欢迎小伙伴指正~