
允许 Prometheus 通过 NAT 抓取指标的工具 - PushProx
我们知道 Prometheus 是 Pull 模式去拉取监控指标的,但是在有些场景下面并不能直接访问到的时候,就需要使用一些附加的方式,PushProx 就是应用于这种场景的。PushProx 是一个客户端和代理,它允许 Prometheus 穿透 NAT 和其他类似的网络拓扑,同时仍然遵循 Pull 模式拉取指标。
架构
PushProx 主要由 proxy 和 client 两部分组成,proxy 负责接收来自 prometheus server 的 metric 请求,然后 proxy 将请求信息 proxy 给 client,client 找本地设备获取到 metric 后,将结果返回给 proxy。要求 proxy 部署在 prometheus 能够访问到的地方,client 则部署在需要采集的 node 所在的网络。
它适用于以下网络环境:
Prometheus 无法直接访问客户端 ECS Prometheus 可以访问客户端所在 VPC 中的 ECS(PushProx 代理),可通过内网穿透或者暴露公网的方式使其可达 PushProx 代理 客户EC和 PushProx 代理处于同一VPC
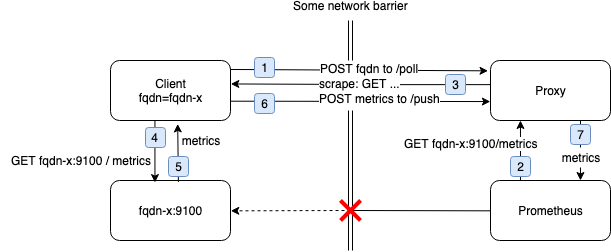
每个客户端有其 fqdn 标识,Prometheus 通过 PushProx 抓取目标 fqdn-x时,执行以下的操作过程:
客户端轮询代理,以获取抓取请求,并将其 fqdn 包含在轮询中(1);客户端发送 POST 请求到代理端,此时代理未响应 Prometheus 尝试通过代理,抓取主机名为 fqdn-x 的目标(2)。Prometheus 发送 GET 请求到代理端,代理根据 fqdn-x 路由到正确的客户端,此时代理未响应 抓取请求位于轮询中的,代理发送给客户端的响应报文中,以响应步骤1中的客户端POST请求(3) 抓取请求由客户端执行(4) 抓取到的数据包含指标的响应(5),并且发布到代理中(6) 代理将其返回给 Prometheus 中(7),作为步骤2中 Prometheus 发送GET请求时的响应报文
PushProx 透明地传递所有 HTTP 标头,压缩和接受编码等功能取决于抓取 Prometheus 服务器。
测试
这里测试我们需要用到以下组件进行测试:
node_exporter 暴露 node 的一些基础 metric pushprox-client 和 node_exporter 一起部署在需要收集的 NAT 环境下的 node 上 pushprox-proxy 和 prometheus 都部署在外网。prometheus 可以访问到 pushprox-proxy 的服务。
proxy 对 client 进行 TLS 认证
由于目前 proxy 和 client 之间没有做认证,client 所在 ip 不确定,proxy 无法针对 client 配置防火墙策略,需要增加 proxy 和 client 之间的认证。
使用 tls 来对 client 进行校验。pushprox-proxy 不支持 tls,需要 nginx 作为反向代理到 pushprox-proxy,然后 nginx 上配置 tls,并且在 nginx 上开启 ssl_verify_client 。pushprox-client 支持 tls 客户端连接到 nginx 。pushprox-client 要求 tls 要支持 SAN(Subject Alternative Name) 是SSL 标准x509 中定义的一个扩展)。所以生成自签名证书的时候需要支持 SAN 。这里我们可以参考 https://github.com/ljq/gen-tlsv3-san-ca 来生成自签名证书。
启动 pushprox-proxy
pushprox-proxy 需要部署在公网的服务器上,而且 pushprox-proxy 要跟每个 client 保持一个长连接,如果 client 比较多, proxy 要考虑负载均衡。
./pushprox-proxy
配置 nginx
nginx 反向代理到 pushprox-proxy, nginx 上配置 tls(pushprox.conf):
upstream prox-backend {
    server 127.0.0.1:8080;
}

server {
        listen 443 ssl;
        server_name promprox.k8s.local;
        ssl on;
        ssl_certificate /opt/xk-self-cert/server.crt; #配置证书位置
        ssl_certificate_key /opt/xk-self-cert/server.key; #配置秘钥位置
        ssl_client_certificate /opt/xk-self-cert/ca.crt; #双向认证
        ssl_verify_client on; #双向认证
        ssl_session_timeout 5m;
        ssl_protocols SSLv2 SSLv3 TLSv1 TLSv1.1 TLSv1.2 TLSv1.3; #按照这个协议配置
        ssl_ciphers ECDHE-RSA-AES128-GCM-SHA256:HIGH:!aNULL:!MD5:!RC4:!DHE; #按照这个套件配置
        ssl_prefer_server_ciphers on;

        location / {
            proxy_pass       http://prox-backend/;
        }
}
启动 client
pushprox-client 要配置自签名证书中的 ca 和 client crt
./pushprox-client --proxy-url=https://promprox.k8s.local --tls.cacert=/opt/xk-self-cert/ca.crt --tls.cert=/opt/xk-self-cert/client.crt --tls.key=/opt/xk-self-cert/client.key
启动 prometheus
./prometheus --config.file=prometheus-prox.yml
配置文件如下所示:
# prometheus-prox.yml

global:
  scrape_interval:     15s
  evaluation_interval: 15s

# A scrape configuration containing exactly one endpoint to scrape:
# Here it's Prometheus itself.
scrape_configs:
  - job_name: node
    proxy_url: http://xx.xx.xx.xx:8080/ # 配置为 proxy 的地址
    static_configs:
      - targets: ['ceph-local:9100']  # Presuming the FQDN of the client is "client".
正常就可以抓取到指标数据了。
仓库地址:https://github.com/prometheus-community/PushProx