
如何正确计算 Kubernetes 容器 CPU 使用率

参数解释
使用 Prometheus 配置 kubernetes 环境中 Container 的 CPU 使用率时,会经常遇到 CPU 使用超出 100%,下面就来解释一下:
container_spec_cpu_period
当对容器进行 CPU 限制时,CFS 调度的时间窗口,又称容器 CPU 的时钟周期通常是 100,000 微秒
container_spec_cpu_quota
是指容器的使用 CPU 时间周期总量,如果 quota 设置的是 700,000,就代表该容器可用的 CPU 时间是 7*100,000 微秒,通常对应 kubernetes 的 resource.cpu.limits 的值
container_spec_cpu_share
是指 container 使用分配主机 CPU 相对值,比如 share 设置的是 500m,代表窗口启动时向主机节点申请 0.5 个 CPU,也就是 50,000 微秒,通常对应 kubernetes 的 resource.cpu.requests 的值
container_cpu_usage_seconds_total
统计容器的 CPU 在一秒内消耗使用率,应注意的是该 container 所有的 CORE
container_cpu_system_seconds_total
统计容器内核态在一秒时间内消耗的 CPU
container_cpu_user_seconds_total
统计容器用户态在一秒时间内消耗的 CPU
参考官方地址 https://docs.signalfx.com/en/latest/integrations/agent/monitors/cadvisor.html https://github.com/google/cadvisor/blob/master/docs/storage/prometheus.md
具体公式
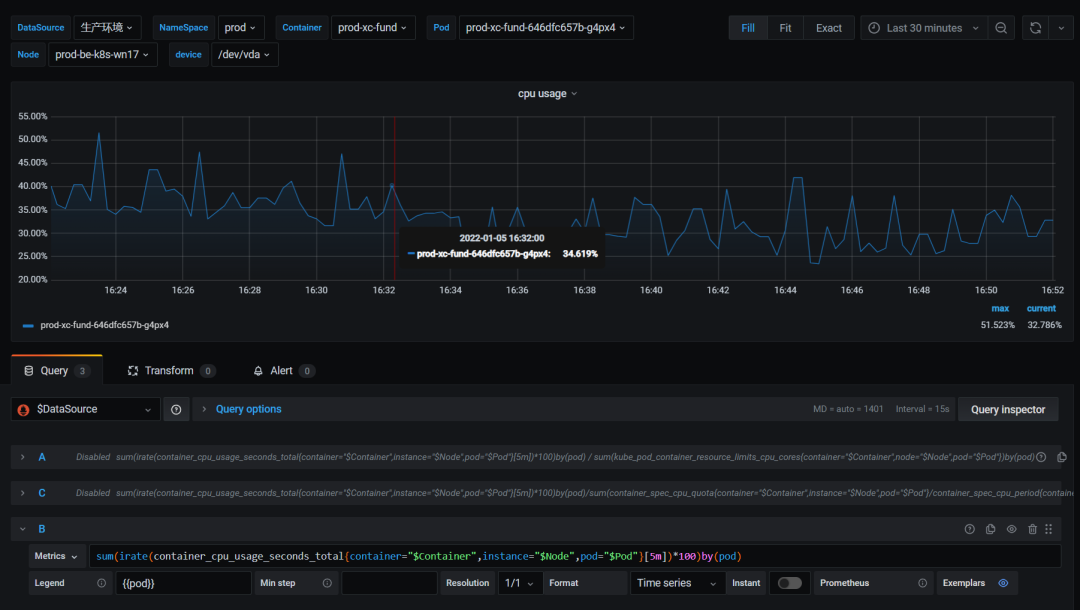
默认如果直接使用 container_cpu_usage_seconds_total 的话,如下
sum(irate(container_cpu_usage_seconds_total{container="$Container",instance="$Node",pod="$Pod"}[5m])*100)by(pod)默认统计的数据是该容器所有的 CORE 的平均使用率
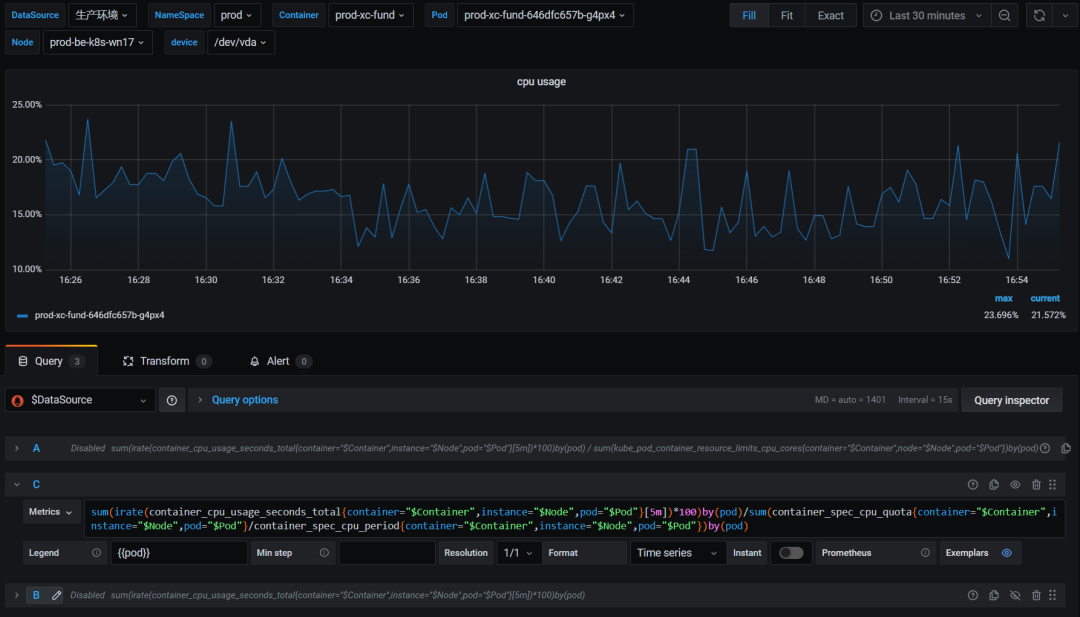
如果要精确计算每个容器的 CPU 使用率,使用 % 呈现的形式,如下
sum(irate(container_cpu_usage_seconds_total{container="$Container",instance="$Node",pod="$Pod"}[5m])*100)by(pod)/sum(container_spec_cpu_quota{container="$Container",instance="$Node",pod="$Pod"}/container_spec_cpu_period{container="$Container",instance="$Node",pod="$Pod"})by(pod)其中 container_spec_cpu_quota/container_spec_cpu_period,就代表该容器有多少个 CORE
参考官方 git issue
https://github.com/google/cadvisor/issues/2026#issuecomment-415819667
docker stats
docker stats 输出的指标列是如何计算的,如下:
首先 docker stats 是通过 Docker API /containers/(id)/stats 接口来获得 live data stream,再通过 docker stats 进行整合。
在 Linux 中使用 docker stats 输出的内存使用率(MEM USAGE),实则该列的计算是不包含 Cache 的内存。
cache usage 在 ≤ docker 19.03 版本的 API 接口输出对应的字段是 memory_stats.total_inactive_file,而 > docker 19.03 的版本对应的字段是 memory_stats.cache。
docker stats 输出的 PIDS 一列代表的是该容器创建的进程或线程的数量,threads 是 Linux kernel 中的一个术语,又称 lightweight process & kernel task。
如何通过 Docker API 查看容器资源使用率,如下
$ curl -s --unix-socket /var/run/docker.sock "http://localhost/v1.40/containers/10f2db238edc/stats" | jq -r
{
  "read": "2022-01-05T06:14:47.705943252Z",
  "preread": "0001-01-01T00:00:00Z",
  "pids_stats": {
    "current": 240
  },
  "blkio_stats": {
    "io_service_bytes_recursive": [
      {
        "major": 253,
        "minor": 0,
        "op": "Read",
        "value": 0
      },
      {
        "major": 253,
        "minor": 0,
        "op": "Write",
        "value": 917504
      },
      {
        "major": 253,
        "minor": 0,
        "op": "Sync",
        "value": 0
      },
      {
        "major": 253,
        "minor": 0,
        "op": "Async",
        "value": 917504
      },
      {
        "major": 253,
        "minor": 0,
        "op": "Discard",
        "value": 0
      },
      {
        "major": 253,
        "minor": 0,
        "op": "Total",
        "value": 917504
      }
    ],
    "io_serviced_recursive": [
      {
        "major": 253,
        "minor": 0,
        "op": "Read",
        "value": 0
      },
      {
        "major": 253,
        "minor": 0,
        "op": "Write",
        "value": 32
      },
      {
        "major": 253,
        "minor": 0,
        "op": "Sync",
        "value": 0
      },
      {
        "major": 253,
        "minor": 0,
        "op": "Async",
        "value": 32
      },
      {
        "major": 253,
        "minor": 0,
        "op": "Discard",
        "value": 0
      },
      {
        "major": 253,
        "minor": 0,
        "op": "Total",
        "value": 32
      }
    ],
    "io_queue_recursive": [],
    "io_service_time_recursive": [],
    "io_wait_time_recursive": [],
    "io_merged_recursive": [],
    "io_time_recursive": [],
    "sectors_recursive": []
  },
  "num_procs": 0,
  "storage_stats": {},
  "cpu_stats": {
    "cpu_usage": {
      "total_usage": 251563853433744,
      "percpu_usage": [
        22988555937059,
        6049382848016,
        22411490707722,
        5362525449957,
        25004835766513,
        6165050456944,
        27740046633494,
        6245013152748,
        29404953317631,
        5960151933082,
        29169053441816,
        5894880727311,
        25772990860310,
        5398581194412,
        22856145246881,
        5140195759848
      ],
      "usage_in_kernelmode": 30692640000000,
      "usage_in_usermode": 213996900000000
    },
    "system_cpu_usage": 22058735930000000,
    "online_cpus": 16,
    "throttling_data": {
      "periods": 10673334,
      "throttled_periods": 1437,
      "throttled_time": 109134709435
    }
  },
  "precpu_stats": {
    "cpu_usage": {
      "total_usage": 0,
      "usage_in_kernelmode": 0,
      "usage_in_usermode": 0
    },
    "throttling_data": {
      "periods": 0,
      "throttled_periods": 0,
      "throttled_time": 0
    }
  },
  "memory_stats": {
    "usage": 8589447168,
    "max_usage": 8589926400,
    "stats": {
      "active_anon": 0,
      "active_file": 260198400,
      "cache": 1561460736,
      "dirty": 3514368,
      "hierarchical_memory_limit": 8589934592,
      "hierarchical_memsw_limit": 8589934592,
      "inactive_anon": 6947250176,
      "inactive_file": 1300377600,
      "mapped_file": 0,
      "pgfault": 3519153,
      "pgmajfault": 0,
      "pgpgin": 184508478,
      "pgpgout": 184052901,
      "rss": 6947373056,
      "rss_huge": 6090129408,
      "total_active_anon": 0,
      "total_active_file": 260198400,
      "total_cache": 1561460736,
      "total_dirty": 3514368,
      "total_inactive_anon": 6947250176,
      "total_inactive_file": 1300377600,
      "total_mapped_file": 0,
      "total_pgfault": 3519153,
      "total_pgmajfault": 0,
      "total_pgpgin": 184508478,
      "total_pgpgout": 184052901,
      "total_rss": 6947373056,
      "total_rss_huge": 6090129408,
      "total_unevictable": 0,
      "total_writeback": 0,
      "unevictable": 0,
      "writeback": 0
    },
    "limit": 8589934592
  },
  "name": "/k8s_prod-xc-fund_prod-xc-fund-646dfc657b-g4px4_prod_523dcf9d-6137-4abf-b4ad-bd3999abcf25_0",
  "id": "10f2db238edc13f538716952764d6c9751e5519224bcce83b72ea7c876cc0475"
如何计算
官方地址
https://docs.docker.com/engine/api/v1.40/#operation/ContainerStats
The
precpu_statsis the CPU statistic of the previous read, and is used to calculate the CPU usage percentage. It is not an exact copy of thecpu_statsfield.If either
precpu_stats.online_cpusorcpu_stats.online_cpusis nil then for compatibility with older daemons the length of the correspondingcpu_usage.percpu_usagearray should be used.To calculate the values shown by the
statscommand of the docker cli tool the following formulas can be used:used_memory = memory_stats.usage - memory_stats.stats.cacheavailable_memory = memory_stats.limitMemory usage % = (used_memory / available_memory) * 100.0cpu_delta = cpu_stats.cpu_usage.total_usage - precpu_stats.cpu_usage.total_usagesystem_cpu_delta = cpu_stats.system_cpu_usage - precpu_stats.system_cpu_usagenumber_cpus = lenght(cpu_stats.cpu_usage.percpu_usage)orcpu_stats.online_cpusCPU usage % = (cpu_delta / system_cpu_delta) * number_cpus * 100.0
链接:https://www.cnblogs.com/apink/p/15767687.html
(版权归原作者所有,侵删)
10T 技术资源大放送!包括但不限于:Linux、虚拟化、容器、云计算、网络、Python、Go 等。在开源Linux公众号内回复「10T」,即可免费获取!
shell编程100例(附PDF下载)
IPv6技术白皮书(附PDF下载)
Linux主流发行版本配置IP总结(Ubuntu、CentOS、Redhat、Suse)
批量安装Windows系统
无人值守批量安装服务器
运维必备的《网络端口大全》,看这一份就够了。
收藏:服务器和存储知识入门
什么叫SSH?原理详解,看这一篇就够了!
Nginx面试40问(收藏吃灰)
20 个 Linux 服务器性能调优技巧
超详细!一文带你了解LVS四层负载均衡企业级实践!
收藏 | Linux系统日志位置及包含的日志内容介绍
100 道 Linux 常见面试题,建议收藏,慢慢读~
服务器12种基本故障+排查方法
IT运维管理常用工具大全,让你成为真正的高手
什么是QoS?
 有收获,点个在看
shell编程100例(附PDF下载)
IPv6技术白皮书(附PDF下载)
Linux主流发行版本配置IP总结(Ubuntu、CentOS、Redhat、Suse)
批量安装Windows系统
无人值守批量安装服务器
运维必备的《网络端口大全》,看这一份就够了。
收藏:服务器和存储知识入门
什么叫SSH?原理详解,看这一篇就够了!
Nginx面试40问(收藏吃灰)
20 个 Linux 服务器性能调优技巧
超详细!一文带你了解LVS四层负载均衡企业级实践!
收藏 | Linux系统日志位置及包含的日志内容介绍
100 道 Linux 常见面试题,建议收藏,慢慢读~
服务器12种基本故障+排查方法
IT运维管理常用工具大全,让你成为真正的高手
什么是QoS?