
Spring Boot整合 Prometheus
Micrometer简介
Micrometer 为 Java 平台上的性能数据收集提供了一个通用的 API,应用程序只需要使用 Micrometer 的通用 API 来收集性能指标即可。Micrometer 会负责完成与不同监控系统的适配工作。这就使得切换监控系统变得很容易。Micrometer 还支持推送数据到多个不同的监控系统。Micrometer类似日志系统中SLF4J。
Micrometer中有两个最核心的概念,分别是是计量器(Meter)和计量器注册表(MeterRegistry),下面来分别看下这两个概念。
计量器(Meter)
Meter用来收集性能指标数据(Metris),总共有四种类型的Meter,分别是Counter,Gauge,Timer,Summary。
每个Meter都有自己的名称,同时Meter可以指定一系列的tag。tag是以key-value的形式出现,这样我们就可以根据tag对指标进行过滤。除了每个Meter独有的标签外,也可以通过MeterRegistry添加通用的tag。
MeterRegistry.Config config = simpleMeterRegistry.config();
    config.commonTags("tag1","value1","tag2","value2");
Counter
Counter只允许增加值,Counter所表示的计数值是double类型,默认情况下增加的值是1.0
@Autowired
private SimpleMeterRegistry simpleMeterRegistry;

@Bean
public Counter counter1(){
    return Counter.builder("test.count1").register(simpleMeterRegistry);
}

@Bean
public Counter counter2(){
    return simpleMeterRegistry.counter("test.count2");
}

@Test
public void test(){
    counter1.increment();
}
Gauge
Cauge是表示单个的变化的值,例如温度,气压。与Counter的区别在于,Gauge的值不总是增加的
public void guage(){
    Gauge.builder("guaua1", this::getValue).register(simpleMeterRegistry);
}

public double getValue(){
    return ThreadLocalRandom.current().nextDouble();
}
Gauge对象一旦被创建,就不能手动对其中的值进行修改。在每次取样时,Gauge 会返回当前值
Timer
Timer通常用来记录事件的持续时间。Timer会记录两类的数据,事件的数量和总的持续时间。Timer提供了不同方式来记录持续时间。第一种方式是使用record()方法来记录Runnable和Callable对象的运行时间,第二种方式是使用Timer.Sample来保存计时状态
public void record(){
    Timer timer = simpleMeterRegistry.timer("record");
    timer.record(() -> {
        try {
            Thread.sleep(3000);
        }catch (Exception e){
            e.printStackTrace();
        }
    });
}

public void sample(){
    Timer.Sample sample = Timer.start();
    new Thread(()->{
        try {
            Thread.sleep(3000);
        }catch (Exception e){
            e.printStackTrace();
        }
        sample.stop(simpleMeterRegistry.timer("sample"));
    });
}
summary
summary用来记录指标的分布,summary根据每个指标的值,把值分配到对应的bucket中。Micrometer默认的bucket的值从1到Long.MAX_VALUE,可以通过minimumExpectedValue和maximumExpectedValue来控制bucket的范围,如果指标的值较小,还可以通过scale来设置一个值对数值进行放大
public void summary(){
    DistributionSummary summary = DistributionSummary.builder("summary")
            .maximumExpectedValue(10L)
            .minimumExpectedValue(1L)
            .publishPercentiles(0.5, 0.75, 0.9)
            .register(simpleMeterRegistry);

    summary.record(1.0);
    summary.record(5.0);
    summary.record(4.5);
    summary.record(3.0);

    System.out.println(summary.takeSnapshot());
}
计量器注册表(MeterRegistry)
MeterRegistry负责创建和维护Meter。每一个监控系统有自己独有的registry
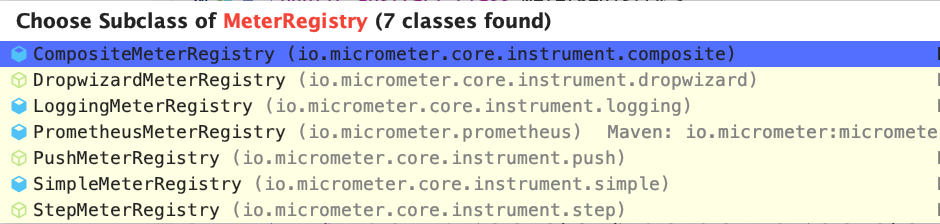
其中SimpleMeterRegistry是一个基于内存的注册表,它不支持导出数据到监控系统,主要用来进行本地开发和测试。
Micrometer支持多个不同的监控系统,通过CompositeMeterRegistry可以把多个计量器注册表组合起来,从而允许同时发布数据到多个监控系统中。
public void compositeRegistry(){
        CompositeMeterRegistry compositeMeterRegistry = new CompositeMeterRegistry();
        compositeMeterRegistry.add(new SimpleMeterRegistry());
        compositeMeterRegistry.add(new SimpleMeterRegistry(new SimpleConfig() {
            @Override
            public String get(String s) {
                return null;
            }

            //增加前缀
            @Override
            public String prefix() {
                return "simple";
            }
        },Clock.SYSTEM));

        Counter counter = compositeMeterRegistry.counter("test");
        counter.increment();
    }
Micrometer本身提供了一个静态的全局注册表Metrics.golbalRegistry。这个注册表一个组合注册表,使用Metrics类中的静态方法创建的计量器,都会被添加到这个全局注册表中
public void globalRegistry(){
    Metrics.addRegistry(simpleMeterRegistry);
    Counter global = Metrics.counter("global");
    global.increment();
}
SpringBoot Actuator
上述介绍了Micrometer的一些简单使用,从Spring Boot2.0开始,Micrometer就是Spring Boot默认提供的性能指标收集库。SpringBoot Actuator提供了对Micrometer的自动配置。在项目中引入SpringBoot Actuator,
<dependency>
    <groupId>org.springframework.boot</groupId>
    <artifactId>spring-boot-starter-actuator</artifactId>
</dependency>
并在配置文件中,增加如下配置
Actuator可对外默认的服务,*表示显示所有
management.endpoints.web.exposure.include=*
启动项目,访问http://8080/actuator,就可以看到Actuator提供的所有监控
{
  "_links": {
    "self": {
      "href": "http://localhost:8080/actuator",
      "templated": false
    },
    "auditevents": {
      "href": "http://localhost:8080/actuator/auditevents",
      "templated": false
    },
    "beans": {
      "href": "http://localhost:8080/actuator/beans",
      "templated": false
    },
    "caches-cache": {
      "href": "http://localhost:8080/actuator/caches/{cache}",
      "templated": true
    },
    "caches": {
      "href": "http://localhost:8080/actuator/caches",
      "templated": false
    },
    "health": {
      "href": "http://localhost:8080/actuator/health",
      "templated": false
    },
    "health-component": {
      "href": "http://localhost:8080/actuator/health/{component}",
      "templated": true
    },
    "health-component-instance": {
      "href": "http://localhost:8080/actuator/health/{component}/{instance}",
      "templated": true
    },
    "conditions": {
      "href": "http://localhost:8080/actuator/conditions",
      "templated": false
    },
    "configprops": {
      "href": "http://localhost:8080/actuator/configprops",
      "templated": false
    },
    "env": {
      "href": "http://localhost:8080/actuator/env",
      "templated": false
    },
    "env-toMatch": {
      "href": "http://localhost:8080/actuator/env/{toMatch}",
      "templated": true
    },
    "info": {
      "href": "http://localhost:8080/actuator/info",
      "templated": false
    },
    "loggers": {
      "href": "http://localhost:8080/actuator/loggers",
      "templated": false
    },
    "loggers-name": {
      "href": "http://localhost:8080/actuator/loggers/{name}",
      "templated": true
    },
    "heapdump": {
      "href": "http://localhost:8080/actuator/heapdump",
      "templated": false
    },
    "threaddump": {
      "href": "http://localhost:8080/actuator/threaddump",
      "templated": false
    },
    "prometheus": {
      "href": "http://localhost:8080/actuator/prometheus",
      "templated": false
    },
    "metrics": {
      "href": "http://localhost:8080/actuator/metrics",
      "templated": false
    },
    "metrics-requiredMetricName": {
      "href": "http://localhost:8080/actuator/metrics/{requiredMetricName}",
      "templated": true
    },
    "scheduledtasks": {
      "href": "http://localhost:8080/actuator/scheduledtasks",
      "templated": false
    },
    "httptrace": {
      "href": "http://localhost:8080/actuator/httptrace",
      "templated": false
    },
    "mappings": {
      "href": "http://localhost:8080/actuator/mappings",
      "templated": false
    }
  }
}
访问http://localhost:8080/actuator/metrics,可以看到Actuator默认收集的监控指标,包括JVM相关指标(内存使用,垃圾收集),tomcat相关指标,数据库连接池还是系统相关指标
{
  "names": [
    "jvm.memory.max",
    "jvm.threads.states",
    "process.files.max",
    "jvm.gc.memory.promoted",
    "system.load.average.1m",
    "jvm.memory.used",
    "jvm.gc.max.data.size",
    "jvm.gc.pause",
    "jvm.memory.committed",
    "system.cpu.count",
    "logback.events",
    "tomcat.global.sent",
    "jvm.buffer.memory.used",
    "tomcat.sessions.created",
    "jvm.threads.daemon",
    "system.cpu.usage",
    "jvm.gc.memory.allocated",
    "tomcat.global.request.max",
    "tomcat.global.request",
    "tomcat.sessions.expired",
    "jvm.threads.live",
    "jvm.threads.peak",
    "tomcat.global.received",
    "process.uptime",
    "tomcat.sessions.rejected",
    "process.cpu.usage",
    "http.server.requests",
    "tomcat.threads.config.max",
    "jvm.classes.loaded",
    "jvm.classes.unloaded",
    "tomcat.global.error",
    "tomcat.sessions.active.current",
    "tomcat.sessions.alive.max",
    "jvm.gc.live.data.size",
    "tomcat.threads.current",
    "process.files.open",
    "jvm.buffer.count",
    "jvm.buffer.total.capacity",
    "tomcat.sessions.active.max",
    "tomcat.threads.busy",
    "process.start.time"
  ]
}
我们可以通过以下链接来查看具体某个指标
http://localhost:8080/actuator/metrics/metricName
其中metricName为需要查看指标的名称,例如查看jvm内存
http://localhost:8080/actuator/metrics/jvm.memory.used
从上图中我们可以看到jvm.memory.used有两个tag,area和id,area指定内存位置(堆内存和非堆内存),id指定内存分类,我们可以指定tag来查看更细致的指标
http://localhost:8080/actuator/metrics/jvm.memory.used?tag=area:heap
http://localhost:8080/actuator/metrics/jvm.memory.used?tag=area:heap&tag=id:PS%20Eden%20Space
Prometheus
Micrometer支持Prometheus,Micrometer提供PrometheusMeterRegistry注册表,用于将指标转为Prometheus格式的指标。首先需要在pom文件引入依赖
<dependency>
    <groupId>io.micrometer</groupId>
    <artifactId>micrometer-registry-prometheus</artifactId>
</dependency>
其次在配置文件中,配置暴露Prometheus,并允许将指标导入到Prometheus中
management.endpoint.prometheus.enabled=true
management.metrics.export.prometheus.enabled=true
项目启动后,我们访问http://localhost:8080/actuator/prometheus,可以看到指标以变成Prometheus格式的指标
可以安装Prometheus来采集这些指标
docker run -d -p 9090:9090 -v ~/Documents/config/prometheus.yml:/etc/prometheus/prometheus.yml prom/prometheus
其中prometheus.yml配置了采集地址及路径
scrape_configs:
 - job_name: prometheus-test
   metrics_path: /actuator/prometheus
   static_configs:
   - targets: ['172.16.22.50:8080']
172.16.22.50是我本机的地址,你们可以修改为自己的ip地址即可,访问http://localhost:9090/targets可以看到Prometheus采集配置
自定义Metric
我们可以利用Prometheus client自定义metric
package com.wbl.spingbootdemo.prometheus;

import io.prometheus.client.CollectorRegistry;
import io.prometheus.client.Counter;
import org.springframework.beans.factory.annotation.Autowired;
import org.springframework.stereotype.Service;

import javax.annotation.PostConstruct;

/**
 * @author wbl
 * @date 2019-09-29
 */
@Service
public class PrometheusMeter {

    @Autowired
    private CollectorRegistry collectorRegistry;

    // 定义name为prometheus_counter的counter
    public Counter prometheusCounter(){
        return Counter.build().name("prometheus_counter").help("prometheus counter test")
                .register(collectorRegistry);
    }

    @PostConstruct
    public void init(){
        Counter counter = prometheusCounter();
        new Thread(()-> {
            while (true){
                counter.inc();
                try {
                    Thread.sleep(5000);
                } catch (InterruptedException e) {
                    e.printStackTrace();
                }
            }
        }).start();
    }
}
启动项目之后,可以在Prometheus查询页面看到刚刚定义的指标prometheus_counter
总结
Micrometer整合了多个监控系统,包括Prometheus。Micrometer利用Meter收集数据,利用不同的MeterRegistry与不同的监控系统整合
SpringBoot Actuator集成了Micrometer,定义了许多默认的metric,可以在http://localhost:8080/actuator/metrics查看
SpringBoot Actuator可以通过Micrometer将采集的指标导入到Prometheus中
参考文献
Micrometer
Quick Guide to Micrometer
Instrumenting And Monitoring Spring Boot 2 Applications
自定义Metrics:让Prometheus监控你的应用程序
使用 Micrometer 记录 Java 应用性能指标

喜欢,在看