
分布式应用监控: SkyWalking 快速接入实践
分布式应用,会存在各种问题。而要解决这些难题,除了要应用自己做一些监控埋点外,还应该有一些外围的系统进行主动探测,主动发现。
APM工具就是干这活的,SkyWalking 是国人开源的一款优秀的APM应用,已成为apache的顶级项目。
今天我们就来实践下 SkyWalking 下吧。
实践目标:达到监控现有的几个系统,清楚各调用关系,可以找到出性能问题点。
实践步骤:
1. SkyWalking 服务端安装运行;
2. 应用端的接入;
3. 后台查看效果;
4. 分析排查问题;
5. 深入了解(如有心情);
1:SkyWalking 服务端安装
下载应用包:
# 主下载页http://skywalking.apache.org/downloads/# 点开具体下载地址后进行下载,如:wget http://mirrors.tuna.tsinghua.edu.cn/apache/skywalking/6.5.0/apache-skywalking-apm-6.5.0.tar.gz
解压安装包:
tar -xzvf apache-skywalking-apm-6.5.0.tar.gz使用默认配置端口,默认存储方式 h2, 直接启动服务:
./bin/startup.sh好产品就是这么简单!
现在服务端就启起来了,可以打开后台地址查看(默认是8080端口): http://localhost:8080界面如下:
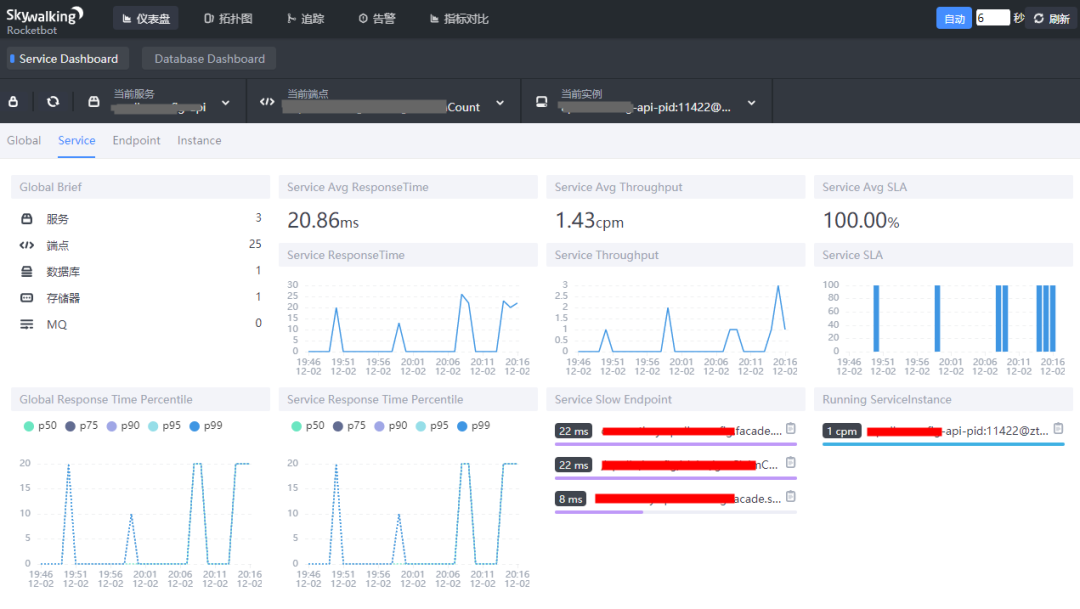
当然,上面是已存在应用的页面。现在你是看不到任何应用的,因为你还没有接入嘛。
2. 应用端的接入
我们只以java应用接入方式实践。
直接使用 javaagent 进行启动即可:
java -javaagent:/root/skywalking/agent/skywalking-agent.jar -Dskywalking.agent.service_name=app1 -Dskywalking.collector.backend_service=localhost:11800 -jar myapp.jar参数说明:
# 参数解释skywalking.agent.service_name: 本应用在skywalking中的名称skywalking.collector.backend_service: skywalking 服务端地址,grpc上报地址,默认端口是 11800# 上面两个参数也可以使用另外的表现形式SW_AGENT_COLLECTOR_BACKEND_SERVICES: 与 skywalking.collector.backend_service 含义相同SW_AGENT_NAME: 与 skywalking.agent.service_name 含义相同
随便访问几个接口或页面,使监控抓取到数据。
再回管理页面,已经看到有节点了。截图如上。
现在我们还可以查看各应用之间的关系了!
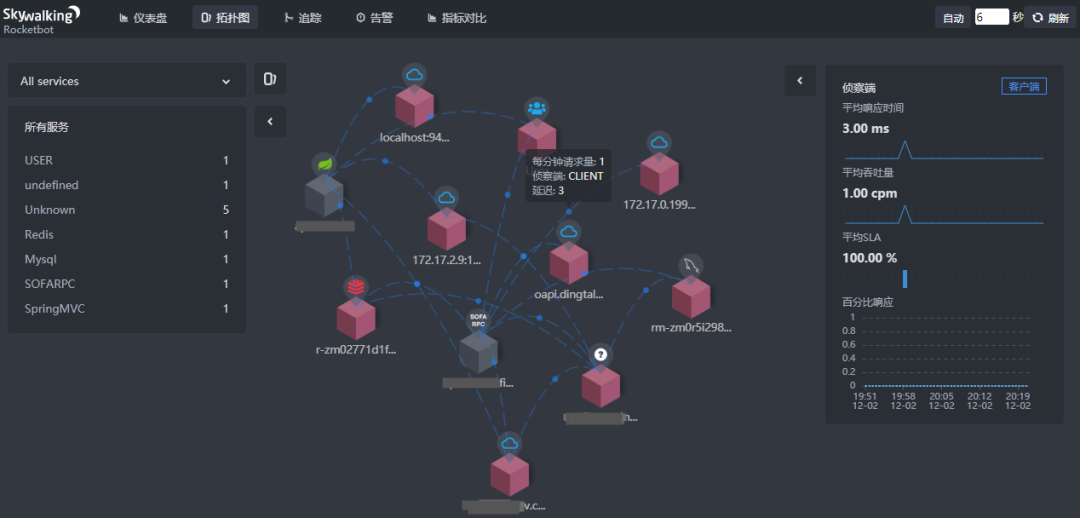
关系清晰吧!一目了然,代码再复杂也不怕了。
我们还可以追踪具体链路:
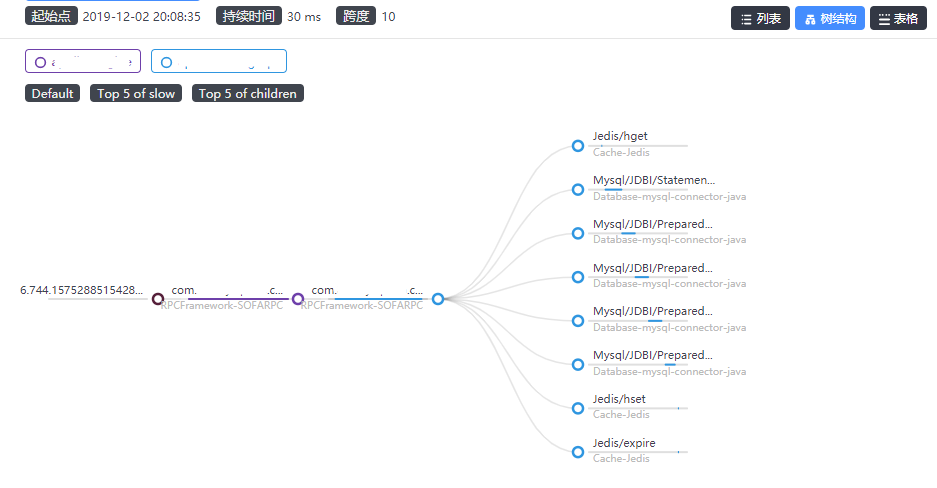
只要知道问题发生的时间点,即可以很快定位到发生问题的接口、系统,快速解决。
3. SkyWalking 配置文件
如上,我们并没有改任何配置文件,就让系统跑起来了。幸运的同时,我们应该要知道更多!至少配置得知道。
config/application.yml : 收集器服务端配置
webapp/webapp.yml : 配置 Web 的端口及获取数据的 OAP(Collector)的IP和端口
agent/config/agent.config : 配置 Agent 信息,如 Skywalking OAP(Collector)的地址和名称
下面是 skywalking 的默认配置,我们可以不用更改就能跑起来一个样例!更改以生产化配置!
config/application.yml
cluster:standalone:# Please check your ZooKeeper is 3.5+, However, it is also compatible with ZooKeeper 3.4.x. Replace the ZooKeeper 3.5+# library the oap-libs folder with your ZooKeeper 3.4.x library.# zookeeper:# nameSpace: ${SW_NAMESPACE:""}# hostPort: ${SW_CLUSTER_ZK_HOST_PORT:localhost:2181}# #Retry Policy# baseSleepTimeMs: ${SW_CLUSTER_ZK_SLEEP_TIME:1000} # initial amount of time to wait between retries# maxRetries: ${SW_CLUSTER_ZK_MAX_RETRIES:3} # max number of times to retry# # Enable ACL# enableACL: ${SW_ZK_ENABLE_ACL:false} # disable ACL in default# schema: ${SW_ZK_SCHEMA:digest} # only support digest schema# expression: ${SW_ZK_EXPRESSION:skywalking:skywalking}# kubernetes:# watchTimeoutSeconds: ${SW_CLUSTER_K8S_WATCH_TIMEOUT:60}# namespace: ${SW_CLUSTER_K8S_NAMESPACE:default}# labelSelector: ${SW_CLUSTER_K8S_LABEL:app=collector,release=skywalking}# uidEnvName: ${SW_CLUSTER_K8S_UID:SKYWALKING_COLLECTOR_UID}# consul:# serviceName: ${SW_SERVICE_NAME:"SkyWalking_OAP_Cluster"}# Consul cluster nodes, example: 10.0.0.1:8500,10.0.0.2:8500,10.0.0.3:8500# hostPort: ${SW_CLUSTER_CONSUL_HOST_PORT:localhost:8500}# nacos:# serviceName: ${SW_SERVICE_NAME:"SkyWalking_OAP_Cluster"}# hostPort: ${SW_CLUSTER_NACOS_HOST_PORT:localhost:8848}# # Nacos Configuration namespace# namespace: 'public'# etcd:# serviceName: ${SW_SERVICE_NAME:"SkyWalking_OAP_Cluster"}# etcd cluster nodes, example: 10.0.0.1:2379,10.0.0.2:2379,10.0.0.3:2379# hostPort: ${SW_CLUSTER_ETCD_HOST_PORT:localhost:2379}core:default:# Mixed: Receive agent data, Level 1 aggregate, Level 2 aggregate# Receiver: Receive agent data, Level 1 aggregate# Aggregator: Level 2 aggregaterole: ${SW_CORE_ROLE:Mixed} # Mixed/Receiver/AggregatorrestHost: ${SW_CORE_REST_HOST:0.0.0.0}restPort: ${SW_CORE_REST_PORT:12800}restContextPath: ${SW_CORE_REST_CONTEXT_PATH:/}gRPCHost: ${SW_CORE_GRPC_HOST:0.0.0.0}gRPCPort: ${SW_CORE_GRPC_PORT:11800}downsampling:- Hour- Day- Month# Set a timeout on metrics data. After the timeout has expired, the metrics data will automatically be deleted.enableDataKeeperExecutor: ${SW_CORE_ENABLE_DATA_KEEPER_EXECUTOR:true} # Turn it off then automatically metrics data delete will be close.dataKeeperExecutePeriod: ${SW_CORE_DATA_KEEPER_EXECUTE_PERIOD:5} # How often the data keeper executor runs periodically, unit is minuterecordDataTTL: ${SW_CORE_RECORD_DATA_TTL:90} # Unit is minuteminuteMetricsDataTTL: ${SW_CORE_MINUTE_METRIC_DATA_TTL:90} # Unit is minutehourMetricsDataTTL: ${SW_CORE_HOUR_METRIC_DATA_TTL:36} # Unit is hourdayMetricsDataTTL: ${SW_CORE_DAY_METRIC_DATA_TTL:45} # Unit is daymonthMetricsDataTTL: ${SW_CORE_MONTH_METRIC_DATA_TTL:18} # Unit is month# Cache metric data for 1 minute to reduce database queries, and if the OAP cluster changes within that minute,# the metrics may not be accurate within that minute.enableDatabaseSession: ${SW_CORE_ENABLE_DATABASE_SESSION:true}storage:# elasticsearch:# nameSpace: ${SW_NAMESPACE:""}# clusterNodes: ${SW_STORAGE_ES_CLUSTER_NODES:localhost:9200}# protocol: ${SW_STORAGE_ES_HTTP_PROTOCOL:"http"}# trustStorePath: ${SW_SW_STORAGE_ES_SSL_JKS_PATH:"../es_keystore.jks"}# trustStorePass: ${SW_SW_STORAGE_ES_SSL_JKS_PASS:""}# user: ${SW_ES_USER:""}# password: ${SW_ES_PASSWORD:""}# indexShardsNumber: ${SW_STORAGE_ES_INDEX_SHARDS_NUMBER:2}# indexReplicasNumber: ${SW_STORAGE_ES_INDEX_REPLICAS_NUMBER:0}# # Those data TTL settings will override the same settings in core module.# recordDataTTL: ${SW_STORAGE_ES_RECORD_DATA_TTL:7} # Unit is day# otherMetricsDataTTL: ${SW_STORAGE_ES_OTHER_METRIC_DATA_TTL:45} # Unit is day# monthMetricsDataTTL: ${SW_STORAGE_ES_MONTH_METRIC_DATA_TTL:18} # Unit is month# # Batch process setting, refer to https://www.elastic.co/guide/en/elasticsearch/client/java-api/5.5/java-docs-bulk-processor.html# bulkActions: ${SW_STORAGE_ES_BULK_ACTIONS:1000} # Execute the bulk every 1000 requests# flushInterval: ${SW_STORAGE_ES_FLUSH_INTERVAL:10} # flush the bulk every 10 seconds whatever the number of requests# concurrentRequests: ${SW_STORAGE_ES_CONCURRENT_REQUESTS:2} # the number of concurrent requests# resultWindowMaxSize: ${SW_STORAGE_ES_QUERY_MAX_WINDOW_SIZE:10000}# metadataQueryMaxSize: ${SW_STORAGE_ES_QUERY_MAX_SIZE:5000}# segmentQueryMaxSize: ${SW_STORAGE_ES_QUERY_SEGMENT_SIZE:200}h2:driver: ${SW_STORAGE_H2_DRIVER:org.h2.jdbcx.JdbcDataSource}url: ${SW_STORAGE_H2_URL:jdbc:h2:mem:skywalking-oap-db}user: ${SW_STORAGE_H2_USER:sa}metadataQueryMaxSize: ${SW_STORAGE_H2_QUERY_MAX_SIZE:5000}# mysql:# properties:# jdbcUrl: ${SW_JDBC_URL:"jdbc:mysql://localhost:3306/swtest"}# dataSource.user: ${SW_DATA_SOURCE_USER:root}# dataSource.password: ${SW_DATA_SOURCE_PASSWORD:root@1234}# dataSource.cachePrepStmts: ${SW_DATA_SOURCE_CACHE_PREP_STMTS:true}# dataSource.prepStmtCacheSize: ${SW_DATA_SOURCE_PREP_STMT_CACHE_SQL_SIZE:250}# dataSource.prepStmtCacheSqlLimit: ${SW_DATA_SOURCE_PREP_STMT_CACHE_SQL_LIMIT:2048}# dataSource.useServerPrepStmts: ${SW_DATA_SOURCE_USE_SERVER_PREP_STMTS:true}# metadataQueryMaxSize: ${SW_STORAGE_MYSQL_QUERY_MAX_SIZE:5000}receiver-sharing-server:default:receiver-register:default:receiver-trace:default:bufferPath: ${SW_RECEIVER_BUFFER_PATH:../trace-buffer/} # Path to trace buffer files, suggest to use absolute pathbufferOffsetMaxFileSize: ${SW_RECEIVER_BUFFER_OFFSET_MAX_FILE_SIZE:100} # Unit is MBbufferDataMaxFileSize: ${SW_RECEIVER_BUFFER_DATA_MAX_FILE_SIZE:500} # Unit is MBbufferFileCleanWhenRestart: ${SW_RECEIVER_BUFFER_FILE_CLEAN_WHEN_RESTART:false}sampleRate: ${SW_TRACE_SAMPLE_RATE:10000} # The sample rate precision is 1/10000. 10000 means 100% sample in default.slowDBAccessThreshold: ${SW_SLOW_DB_THRESHOLD:default:200,mongodb:100} # The slow database access thresholds. Unit ms.receiver-jvm:default:receiver-clr:default:service-mesh:default:bufferPath: ${SW_SERVICE_MESH_BUFFER_PATH:../mesh-buffer/} # Path to trace buffer files, suggest to use absolute pathbufferOffsetMaxFileSize: ${SW_SERVICE_MESH_OFFSET_MAX_FILE_SIZE:100} # Unit is MBbufferDataMaxFileSize: ${SW_SERVICE_MESH_BUFFER_DATA_MAX_FILE_SIZE:500} # Unit is MBbufferFileCleanWhenRestart: ${SW_SERVICE_MESH_BUFFER_FILE_CLEAN_WHEN_RESTART:false}istio-telemetry:default:envoy-metric:default:# alsHTTPAnalysis: ${SW_ENVOY_METRIC_ALS_HTTP_ANALYSIS:k8s-mesh}#receiver_zipkin:# default:# host: ${SW_RECEIVER_ZIPKIN_HOST:0.0.0.0}# port: ${SW_RECEIVER_ZIPKIN_PORT:9411}# contextPath: ${SW_RECEIVER_ZIPKIN_CONTEXT_PATH:/}query:graphql:path: ${SW_QUERY_GRAPHQL_PATH:/graphql}alarm:default:telemetry:none:configuration:none:# apollo:# apolloMeta: http://106.12.25.204:8080# apolloCluster: default# # apolloEnv: # defaults to null# appId: skywalking# period: 5# nacos:# # Nacos Server Host# serverAddr: 127.0.0.1# # Nacos Server Port# port: 8848# # Nacos Configuration Group# group: 'skywalking'# # Nacos Configuration namespace# namespace: ''# # Unit seconds, sync period. Default fetch every 60 seconds.# period : 60# # the name of current cluster, set the name if you want to upstream system known.# clusterName: "default"# zookeeper:# period : 60 # Unit seconds, sync period. Default fetch every 60 seconds.# nameSpace: /default# hostPort: localhost:2181# #Retry Policy# baseSleepTimeMs: 1000 # initial amount of time to wait between retries# maxRetries: 3 # max number of times to retry# etcd:# period : 60 # Unit seconds, sync period. Default fetch every 60 seconds.# group : 'skywalking'# serverAddr: localhost:2379# clusterName: "default"# consul:# # Consul host and ports, separated by comma, e.g. 1.2.3.4:8500,2.3.4.5:8500# hostAndPorts: ${consul.address}# # Sync period in seconds. Defaults to 60 seconds.# period: 1#exporter:# grpc:# targetHost: ${SW_EXPORTER_GRPC_HOST:127.0.0.1}# targetPort: ${SW_EXPORTER_GRPC_PORT:9870}
webapp/webapp.yml
server:port: 8080collector:path: /graphqlribbon:ReadTimeout: 10000# Point to all backend's restHost:restPort, split by ,listOfServers: 127.0.0.1:12800
agent/config/agent.config
# The agent namespace# agent.namespace=${SW_AGENT_NAMESPACE:default-namespace}# The service name in UIagent.service_name=${SW_AGENT_NAME:Your_ApplicationName}# The number of sampled traces per 3 seconds# Negative number means sample traces as many as possible, most likely 100%# agent.sample_n_per_3_secs=${SW_AGENT_SAMPLE:-1}# Authentication active is based on backend setting, see application.yml for more details.# agent.authentication = ${SW_AGENT_AUTHENTICATION:xxxx}# The max amount of spans in a single segment.# Through this config item, skywalking keep your application memory cost estimated.# agent.span_limit_per_segment=${SW_AGENT_SPAN_LIMIT:300}# Ignore the segments if their operation names end with these suffix.# agent.ignore_suffix=${SW_AGENT_IGNORE_SUFFIX:.jpg,.jpeg,.js,.css,.png,.bmp,.gif,.ico,.mp3,.mp4,.html,.svg}# If true, skywalking agent will save all instrumented classes files in `/debugging` folder.# Skywalking team may ask for these files in order to resolve compatible problem.# agent.is_open_debugging_class = ${SW_AGENT_OPEN_DEBUG:true}# The operationName max length# agent.operation_name_threshold=${SW_AGENT_OPERATION_NAME_THRESHOLD:500}# Backend service addresses.collector.backend_service=${SW_AGENT_COLLECTOR_BACKEND_SERVICES:127.0.0.1:11800}# Logging file_namelogging.file_name=${SW_LOGGING_FILE_NAME:skywalking-api.log}# Logging levellogging.level=${SW_LOGGING_LEVEL:DEBUG}# Logging dir# logging.dir=${SW_LOGGING_DIR:""}# Logging max_file_size, default: 300 * 1024 * 1024 = 314572800# logging.max_file_size=${SW_LOGGING_MAX_FILE_SIZE:314572800}# The max history log files. When rollover happened, if log files exceed this number,# then the oldest file will be delete. Negative or zero means off, by default.# logging.max_history_files=${SW_LOGGING_MAX_HISTORY_FILES:-1}# mysql plugin configuration# plugin.mysql.trace_sql_parameters=${SW_MYSQL_TRACE_SQL_PARAMETERS:false}
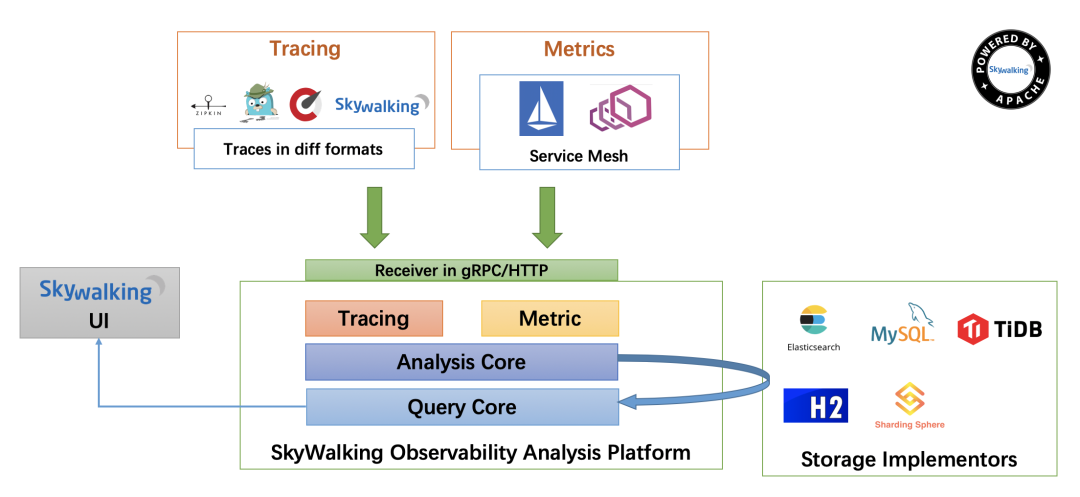
4. SkyWalking 架构
来自官网的图片,感受一下!无须细说,大概原理就是:针对各种不同客户端实现不同的指标采集,统一通过grpc/http发送到apm服务端,然后经过分析引擎后存储到es/h2/mysql等等存储系统,最后由前端通过查询引擎进行展现。
5. 可以用来干啥
发现系统耗时或者说瓶颈在哪里。
发现各系统之间的调用关系。
监控服务异常。
排查系统故障。
6. 其他存储系统接入
h2只是一个内存存储系统,其目的是为了让你能够快速验证快速响应,它还没有强大到足以支撑线上系统运行。
所以,线上一定得选用某个更可靠存储。
一般地,ES会是个不错的选择,一来它以搜索速度著称而这正好符合后台查询的需求,二来es是分布式存储,可以避免一定的大数据量问题。
mysql: 一般地对普通开发同学友好,且单机mysql容易搭建。
tidb: 与mysql协议完全兼容,分布式存储。
配置方法如demo所示。。。

腾讯、阿里、滴滴后台面试题汇总总结 — (含答案)
面试:史上最全多线程面试题 !
最新阿里内推Java后端面试题
JVM难学?那是因为你没认真看完这篇文章

关注作者微信公众号 —《JAVA烂猪皮》
了解更多java后端架构知识以及最新面试宝典


看完本文记得给作者点赞+在看哦~~~大家的支持,是作者源源不断出文的动力
作者:等你归去来
出处:https://www.cnblogs.com/yougewe/p/11973117.html