使用 Lodash 工具后代码行数瞬间缩短...
作者:Timor
来源:SegmentFault 思否社区
背景
最近在做报表.涉及到echarts图表.多层柱状图叠加展示.然后后端给出来的结构是二维数组.需要前端自行处理成图表可用的数据格式.echarts数据是是动态的。
需求效果图的样子:
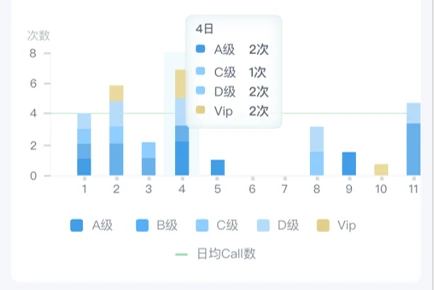
echarts相似的官网案例代码:
option = {
    tooltip: {
        trigger: 'axis',
    },
    legend: {
        data: ['Direct', 'Mail Ad', 'Affiliate Ad', 'Video Ad', 'Search Engine']
    },

    xAxis: {
        type: 'category',
        data: ['Mon', 'Tue', 'Wed', 'Thu', 'Fri', 'Sat', 'Sun']
    },
    yAxis: [
        {
          splitLine: {
            show: false, //去掉网格线
          },
          axisTick: {
            show: true,
            length: 4,
            lineStyle: {
              color: '#D8D8D8',
            },
          },
          axisLabel: {
            show: true,
            color: '#606C7B',
          },
          axisLine: {
            show: true,
            lineStyle: {
              color: '#D8D8D8',
            },
          },
          name: '次数',
          type: 'value',
        },
      ],
    series: [

        {
            name: 'A',
            type: 'bar',
            stack: 'total',
            emphasis: {
                focus: 'series'
            },
            data: [320, 302, 301, 334, 390, 330, 320]
        },
        {
            name: 'B',
            type: 'bar',
            stack: 'total',
            emphasis: {
                focus: 'series'
            },
            data: [120, 132, 101, 134, 90, 230, 210]
        },
        {
            name: 'C',
            type: 'bar',
            stack: 'total',
            emphasis: {
                focus: 'series'
            },
            data: [220, 182, 191, 234, 290, 330, 310]
        },
    ]
};
官网的代码实现示例图 :
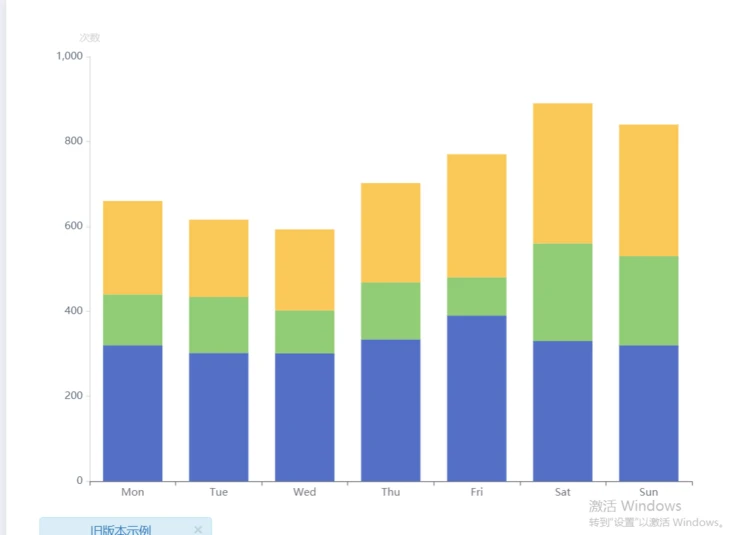
由此可以看到.需要的series里的数据结构是这样的:
{
            name: 'C',  //等级名称
            type: 'bar',
            stack: 'total',
            emphasis: {
                focus: 'series'
            },
            data: [220, 182, 191, 234, 290, 330, 310]  //对应的每一天的值
      },
开始我的数据处理路程
先给出后端返回的数据
var data = [
  {
    dt: 1,
    priority: "A级-高潜",
    call_day_cnt: 0,
  },
  {
    dt: 1,
    priority: "B级-普通",
    call_day_cnt: 0,
  },
  {
    dt: 1,
    priority: "V级-重要",
    call_day_cnt: 0,
  },
  {
    dt: 1,
    priority: "无",
    call_day_cnt: 0,
  },
  {
    dt: 2,
    priority: "A级-高潜",
    call_day_cnt: 0,
  },
  {
    dt: 2,
    priority: "B级-普通",
    call_day_cnt: 0,
  },
  {
    dt: 2,
    priority: "V级-重要",
    call_day_cnt: 0,
  },
  {
    dt: 2,
    priority: "无",
    call_day_cnt: 0,
  },
  {
    dt: 3,
    priority: "A级-高潜",
    call_day_cnt: 0,
  },
  {
    dt: 3,
    priority: "B级-普通",
    call_day_cnt: 0,
  },
  {
    dt: 3,
    priority: "V级-重要",
    call_day_cnt: 0,
  },
  {
    dt: 3,
    priority: "无",
    call_day_cnt: 0,
  },
  {
    dt: 4,
    priority: "A级-高潜",
    call_day_cnt: 0,
  },
  {
    dt: 4,
    priority: "B级-普通",
    call_day_cnt: 0,
  },
  {
    dt: 4,
    priority: "V级-重要",
    call_day_cnt: 0,
  },
  {
    dt: 4,
    priority: "无",
    call_day_cnt: 0,
  },
  {
    dt: 5,
    priority: "A级-高潜",
    call_day_cnt: 0,
  },
  {
    dt: 5,
    priority: "B级-普通",
    call_day_cnt: 0,
  },
  {
    dt: 5,
    priority: "V级-重要",
    call_day_cnt: 0,
  },
  {
    dt: 5,
    priority: "无",
    call_day_cnt: 0,
  },
  {
    dt: 6,
    priority: "A级-高潜",
    call_day_cnt: 0,
  },
  {
    dt: 6,
    priority: "B级-普通",
    call_day_cnt: 0,
  },
  {
    dt: 6,
    priority: "V级-重要",
    call_day_cnt: 0,
  },
  {
    dt: 6,
    priority: "无",
    call_day_cnt: 0,
  },
  {
    dt: 7,
    priority: "A级-高潜",
    call_day_cnt: 0,
  },
  {
    dt: 7,
    priority: "B级-普通",
    call_day_cnt: 0,
  },
  {
    dt: 7,
    priority: "V级-重要",
    call_day_cnt: 0,
  },
  {
    dt: 7,
    priority: "无",
    call_day_cnt: 0,
  },
  {
    dt: 8,
    priority: "A级-高潜",
    call_day_cnt: 0,
  },
  {
    dt: 8,
    priority: "B级-普通",
    call_day_cnt: 0,
  },
  {
    dt: 8,
    priority: "V级-重要",
    call_day_cnt: 0,
  },
  {
    dt: 8,
    priority: "无",
    call_day_cnt: 0,
  },
  {
    dt: 9,
    priority: "A级-高潜",
    call_day_cnt: 0,
  },
  {
    dt: 9,
    priority: "B级-普通",
    call_day_cnt: 0,
  },
  {
    dt: 9,
    priority: "V级-重要",
    call_day_cnt: 0,
  },
  {
    dt: 9,
    priority: "无",
    call_day_cnt: 0,
  }]
1.先拿到所有的等级(不同的人看到的等级是不同的,但是每一天的等级会是一致的)搭建好等级外层数据结构.一个唯一键,一个等级名称,一个等级对应的每天的值data.
var data =[ key: 'levelList' + index, value: item.priority, data: [] ]
//用data存一下后端返回的值
    var data = this.reportList || [];
    //创建外层等级壳子
    var level = [];
    data.map((item, index) => {
      if (item.dt == 1) {
        level.push({
          key: 'levelList' + index,
          value: item.priority,
          data: [],
        });
      }
    });
    //分组
    var json = {};
    for (let i = 0; i < data.length; i++) {
      if (!json.hasOwnProperty(data[i].priority))json[data[i].priority] = [];
      level.map(item => item.value === data[i].priority && item.data.push(data[i]));
    }
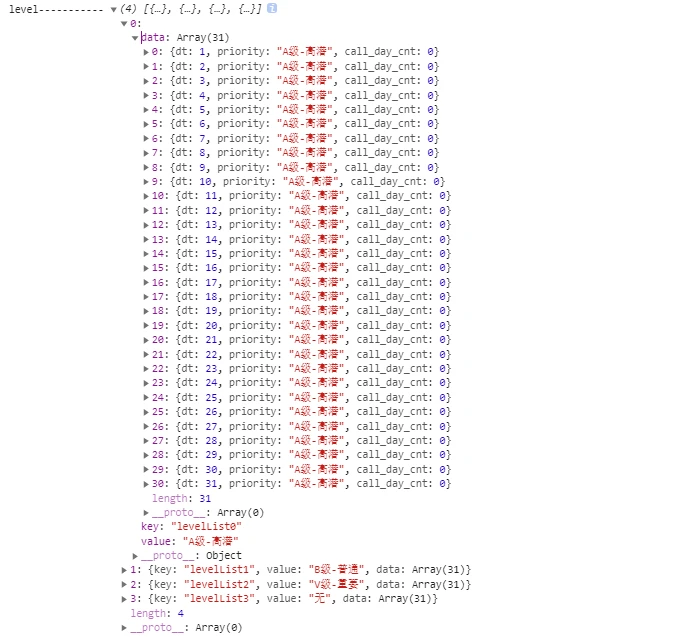
最后得到的数据结构:
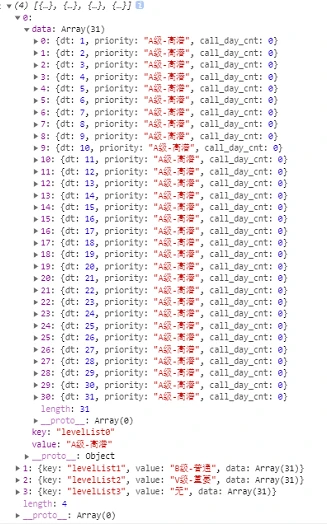
首先项目里安装一下:
npm install lodash然后js里面引用一下:
import _ from 'lodash'然后就可以使用了:
 //用data存一下后端返回的值
 var data = this.reportList || [];
 //priority是分组字段
 const a = _.groupBy(data,'priority')
 console.log('a--------',a)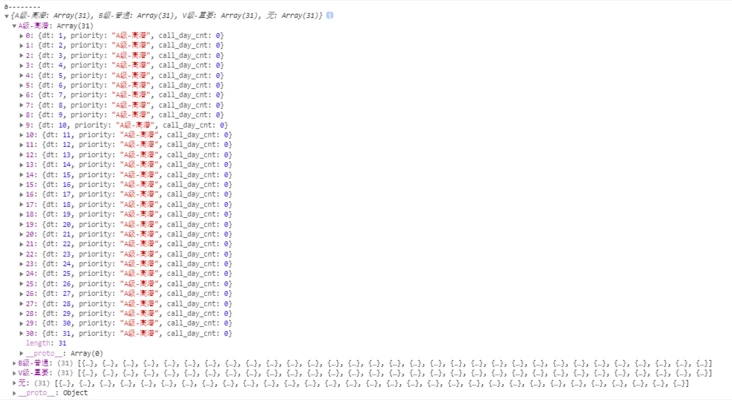
 //用data存一下后端返回的值
 var data = this.reportList || [];
//创建外层等级壳子
    var level = [];
    data.map((item, index) => {
      if (item.dt == 1) {
        level.push({
          key: 'levelList' + index,
          value: item.priority,
          data: [],
        });
      }
    });
    //分组
    const groupList = _.groupBy(data,'priority')
    for(var i in groupList){
      level.map(item => item.value === groupList[i].key && item.data.push(data[i]));
    }
    console.log('level-----------',level)
最后贴出来这个echarts图的整体数据吧
//日均call数
  setDayNumChart=()=>{
    //data保存从后端取回的数据
    var data = this.reportList?.dt_priority_m || [];
    //创建外层等级壳子
    var level = [];
    data.map((item, index) => {
      if (item.dt == 1) {
        level.push({
          key: 'levelList' + index,
          value: item.priority,
          data: [],
        });
      }
    });
    //分组
    const groupList = _.groupBy(data,'priority')
    for(var i in groupList){
      level.map(item => item.value === groupList[i].key && item.data.push(data[i]));
    }
    //抽出series
    var seriesData = [];
    level.map((item) => {
      seriesData.push({
        name: item.value,
        type: 'bar',
        stack: '级别',
        barWidth: '30%',
        emphasis: {
          focus: 'series',
        },
        data: item.data.map((item) => item.call_day_cnt),
      });
    });
   // 提取出X轴的值
    var date = []
    level && level[0].data.map(item => {
      date.push(item.dt)
    })
    // echarts赋值
    this.dayNumChart = {
      title: {
        text: '日均Call数',
        textStyle: {
          show: true,
          color: '#C3C7CC',
          fontSize: 16,
          fontWeight: 400,
        },
      },
      tooltip: {
        trigger: 'axis',
        axisPointer: {
          type: 'shadow',
        },
      },
      legend: {
        bottom: 0,
        data: level.map((item) => item.value),
      },
      xAxis: [
        {
          type: 'category',
          axisTick: {
            alignWithLabel: true,
            length: 3,
            lineStyle: {
              color: '#D8D8D8',
            },
          },
          axisLine: {
            show: true,
            lineStyle: {
              color: '#D8D8D8',
            },
          },
          axisLabel: {
            show: true,
            color: '#606C7B',
          },
          data: date,
        },
      ],
      yAxis: [
        {
          splitLine: {
            show: false, //去掉网格线
          },
          axisTick: {
            show: true,
            length: 4,
            lineStyle: {
              color: '#D8D8D8',
            },
          },
          axisLabel: {
            show: true,
            color: '#606C7B',
          },
          axisLine: {
            show: true,
            lineStyle: {
              color: '#D8D8D8',
            },
          },
          name: '次数',
          type: 'value',
        },
      ],
      // 滑动
      dataZoom: [
        {
          show: true, // 是否显示
          start: 0, // 伸缩条开始位置(1-100),可以随时更改
          type: 'inside',
          throttle: 40,
          endValue: 5,
        },
      ],
      series: seriesData,
    };
  }

评论
