《纽约时报》数据镜头下的女性崛起

大数据文摘出品
来源:medium
编译:Hippo、lin、夏雅薇
媒体镜头下的女性角色能反应一个社会的女性主义崛起。
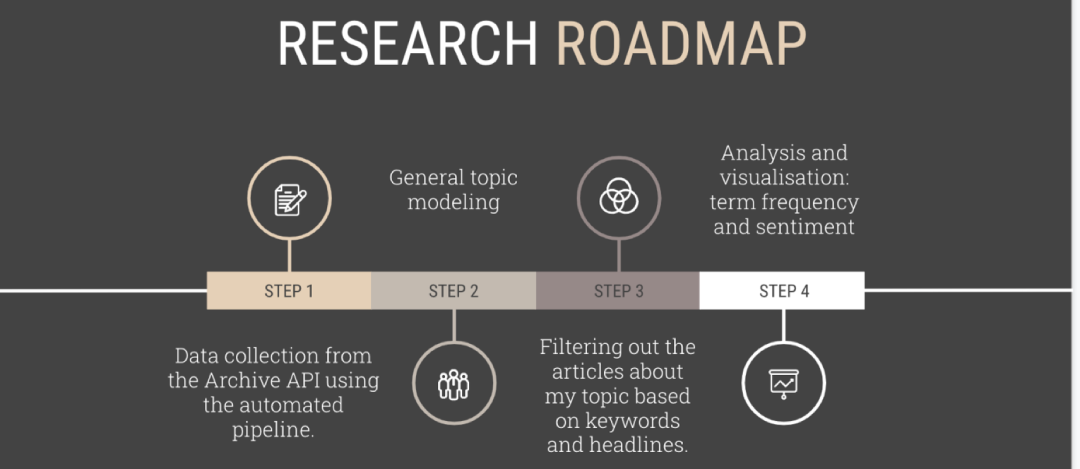
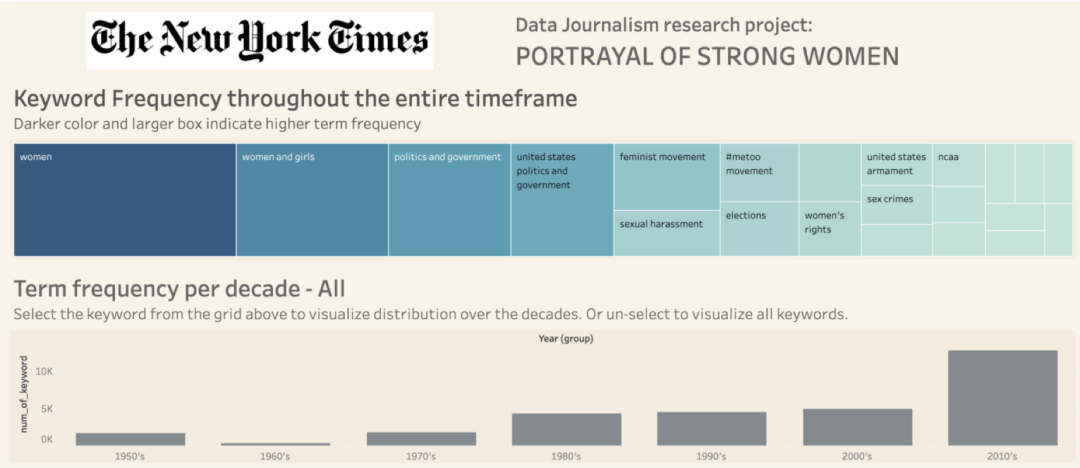
今天,文摘菌给大家介绍的这个项目,就是希望通过情感分析、频繁术语可视化和主题建模,来调查过去70年里女性在《纽约时报》报道中的代表性。
一起看看。
为了进行这项调查,作者通过《纽约时报》开发人员门户网站的归档文件API抓取了《纽约时报》的相关数据。
首先,获取API密钥(钥匙链接地址:https://developer.nytimes.com/)。放心,这是免费的!获取了密钥之后,你就像是打开了《纽约时报》数据大坝的闸门,里面的数据将会源源不断地输送。由于这种类型的API比较适合批量数据的收集,因此不会对数据进行事先过滤。如果您想重新进行试验,请按照发布在Github上的Jupyter notebooks中的说明进行操作。如果您想看这篇文章的视频版本,也可以点击相关链接访问(链接:https://www.youtube.com/watch?v=rK-9t1IS0A4&feature=youtu.be)。
通过作者在GitHub上的my project repository(链接:https://github.com/sasha-talks-tech/New-York-Times)你也可以访问所有的说明、代码笔记和运行结果,可让你更顺利的进行复制。
通过API进行数据收集同时使用SpaCy和Gensim进行主题建模
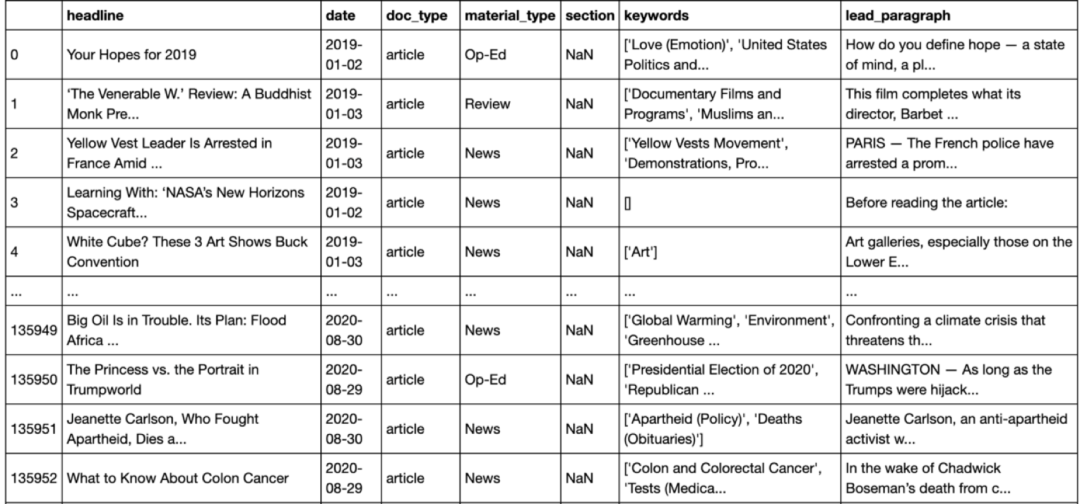
在进一步进行分析之前,先对《纽约时报》自2019年1月至2020年9月的大部分文章进行主题建模,来分析标题、关键词和主要段落。目标是将最普遍的问题和经久不衰的主题区分开来,以确保相关研究遵循《纽约时报》的宗旨,并且不会歪曲他们的新闻风格。
数据收集思路的灵感来自Briena Herold的非常有用的教程(教程链接:https://towardsdatascience.com/collecting-data-from-the-new-york-times-over-any-period-of-time-3e365504004)。
让我们导入必要的工具和库:
import osimport pandas as pdimport requestsimport jsonimport timeimport dateutilimport datetimefrom dateutil.relativedeltaimport relativedeltaimport globDetermine the timeframe of the analysis:end = datetime.date.today()start = datetime.date(2019, 1, 1)
下列helper函数(请参阅教程:https://towardsdatascience.com/collecting-data-from-the-new-york-times-over-any-period-of-time-3e365504004)通过API提取《纽约时报》相关数据将其保存到特定的csv文件中:
def send_request(date):'''Sends a request to the NYT Archive API for given date.''' base_url = 'https://api.nytimes.com/svc/archive/v1/' url = base_url + '/' + date[0] + '/' + date[1] + '.json?api-key=' + 'F9FPP1mJjiX8pAEFAxBYBg08vZECa39n'try: response = requests.get(url, verify=False).json()except Exception:return None time.sleep(6)return responsedef is_valid(article, date):'''An article is only worth checking if it is in range, and has a headline.''' is_in_range = date > start and date < end has_headline = type(article['headline']) == dict and 'main' in article['headline'].keys()return is_in_range and has_headlinedef parse_response(response):'''Parses and returns response as pandas data frame.''' data = {'headline': [], 'date': [],'doc_type': [],'material_type': [],'section': [],'keywords': [],'lead_paragraph': []} articles = response['response']['docs']for article in articles: # For each article, make sure it falls within our date range date = dateutil.parser.parse(article['pub_date']).date()if is_valid(article, date): data['date'].append(date) data['headline'].append(article['headline']['main'])if 'section' in article: data['section'].append(article['section_name'])else: data['section'].append(None) data['doc_type'].append(article['document_type'])if 'type_of_material' in article: data['material_type'].append(article['type_of_material'])else: data['material_type'].append(None) keywords = [keyword['value'] for keyword in article['keywords'] if keyword['name'] == 'subject'] data['keywords'].append(keywords)if 'lead_paragraph' in article: data['lead_paragraph'].append(article['lead_paragraph'])else: data['lead_paragraph'].append(None)return pd.DataFrame(data)def get_data(dates):'''Sends and parses request/response to/from NYT Archive API for given dates.''' total = 0 print('Date range: ' + str(dates[0]) + ' to ' + str(dates[-1]))if not os.path.exists('headlines'): os.mkdir('headlines')for date in dates: print('Working on ' + str(date) + '...') csv_path = 'headlines/' + date[0] + '-' + date[1] + '.csv'if not os.path.exists(csv_path): # If we don't already have this month response = send_request(date)if response is not None: df = parse_response(response) total += len(df) df.to_csv(csv_path, index=False) print('Saving ' + csv_path + '...')print('Number of articles collected: ' + str(total))
让我们详细看下helper函数:
函数send_request(date)向存档发送给定日期的请求,转换成json格式,返回响应。 函数is_valid(article, date)检查某篇文章是否在要求的时间范围内,确认标题的存在,返回is_in_range(在范围内)和has_headline(存在标题)结论。 函数parse_response(response)将响应转换为DataFrame数据集。data是一个字典,它包含DataFrame的列,这些列最初是空的,但将被此函数追加。函数返回最终的DataFrame。
函数get_data(dates):如果日期对应于用户指定的范围,则利用send request()和parse response()函数,将标题和其他信息保存到.csv文件中,每月每年保存一个文件。
# get data file namespath = "headlines/"filenames = glob.glob("*.csv")dfs = []print(filenames)for filename in filenames:dfs.append(pd.read_csv(filename))# Concatenate all data into one DataFramebig_frame = pd.concat(dfs, ignore_index=True)
Importing tools and libraries:from collections import defaultdictimport re, string #regular expressionsfrom gensim import corpora # this is the topic modeling libraryfrom gensim.models import LdaModel
Defaultdict对统计唯一单词的出现很有用。 https://www.geeksforgeeks.org/defaultdict-in-python/ 当我们在文本中查找精确或模糊的匹配项时re和string很有用。如果你对文本分析感兴趣,正则表达式(https://www.w3schools.com/python/python_regex.asp)会是一个常用表达式。如果想要练习,可以点击链接使用便捷工具(https://regex101.com/)。 gensim(https://radimrehurek.com/gensim/)是一个用于主题建模的库, 只要你能搞清必要的相关性(https://www.tutorialspoint.com/gensim/gensim_getting_started.htm), 你会发现它非常好用。
big_frame_corpus_headline = big_frame['headline']big_frame_corpus_keywords = big_frame['keywords']big_frame_corpus_lead = big_frame['lead_paragraph']
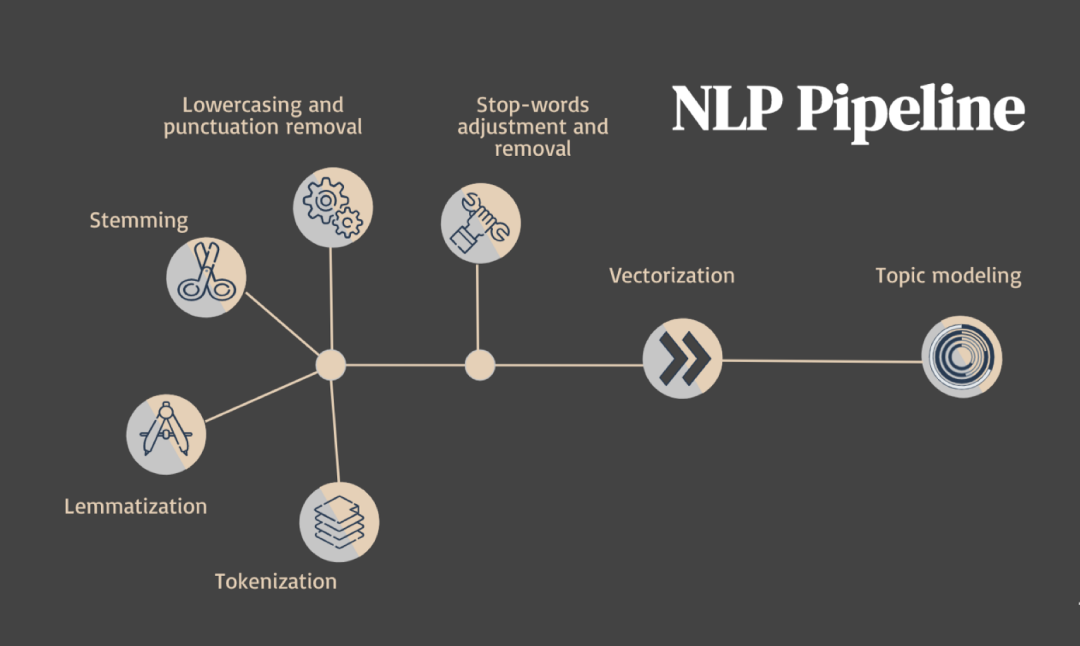
文本预处理步骤。图片由作者提供。图标由Freepik制作。
from nltk.corpus import stopwordsheadlines = [re.sub(r'[^\w\s]','',str(item)) for item in big_frame_corpus_headline]keywords = [re.sub(r'[^\w\s]','',str(item)) for item in big_frame_corpus_keywords]lead = [re.sub(r'[^\w\s]','',str(item)) for item in big_frame_corpus_lead]stopwords = set(stopwords.words('english'))# please note: you can append to this list of pre-defined stopwords if neededMore pre-processing:headline_texts = [[word for word in document.lower().split() if word not in stopwords] for document in headlines]keywords_texts = [[word for word in document.lower().split() if word not in stopwords] for document in keywords]lead_texts = [[word for word in document.lower().split() if word not in stopwords] for document in lead]Removing less frequent words:frequency = defaultdict(int)for headline_text in headline_texts:for token in headline_text:frequency[token] += 1for keywords_text in keywords_texts:for token in keywords_text:frequency[token] += 1for lead_text in lead_texts:for token in lead_text:frequency[token] += 1headline_texts = [[token for token in headline_text if frequency[token] > 1] for headline_text in headline_texts]keywords_texts = [[token for token in keywords_text if frequency[token] > 1] for keywords_text in keywords_texts]lead_texts = [[token for token in lead_text if frequency[token] > 1] for lead_text in lead_texts]dictionary_headline = corpora.Dictionary(headline_texts)dictionary_keywords = corpora.Dictionary(keywords_texts)dictionary_lead = corpora.Dictionary(lead_texts)headline_corpus = [dictionary.doc2bow(headline_text) for headline_text in headline_texts]keywords_corpus = [dictionary.doc2bow(keywords_text) for keywords_text in keywords_texts]lead_corpus = [dictionary.doc2bow(lead_text) for lead_text in lead_texts]Let’s decide on the optimal number of topics for our case:NUM_TOPICS = 5ldamodel_headlines = LdaModel(headline_corpus, num_topics = NUM_TOPICS, id2word=dictionary, passes=12)ldamodel_keywords = LdaModel(keywords_corpus, num_topics = NUM_TOPICS, id2word=dictionary, passes=12)ldamodel_lead = LdaModel(lead_corpus, num_topics = NUM_TOPICS, id2word=dictionary, passes=12)Here’s the result:topics_headlines = ldamodel_headlines.show_topics()for topic_headlines in topics_headlines:print(topic_headlines)topics_keywords = ldamodel_keywords.show_topics()for topic_keywords in topics_keywords:print(topic_keywords)topics_lead = ldamodel_lead.show_topics()for topic_lead in topics_lead:print(topic_lead)Let’s organize those into dataframes:word_dict_headlines = {};for i in range(NUM_TOPICS):words_headlines = ldamodel_headlines.show_topic(i, topn = 20)word_dict_headlines['Topic # ' + '{:02d}'.format(i+1)] = [i[0] for i in words_headlines]pd.DataFrame(word_dict_headlines)for i in range(NUM_TOPICS):words_keywords = ldamodel_keywords.show_topic(i, topn = 20)word_dict_keywords['Topic # ' + '{:02d}'.format(i+1)] = [i[0] for i in words_keywords]pd.DataFrame(word_dict_keywords)for i in range(NUM_TOPICS):words_lead = ldamodel_lead.show_topic(i, topn = 20)word_dict_lead ['Topic # ' + '{:02d}'.format(i+1)] = [i[0] for i in words_lead]pd.DataFrame(word_dict_lead)

主题建模结果。图片由作者提供。图标由Freepik制作。
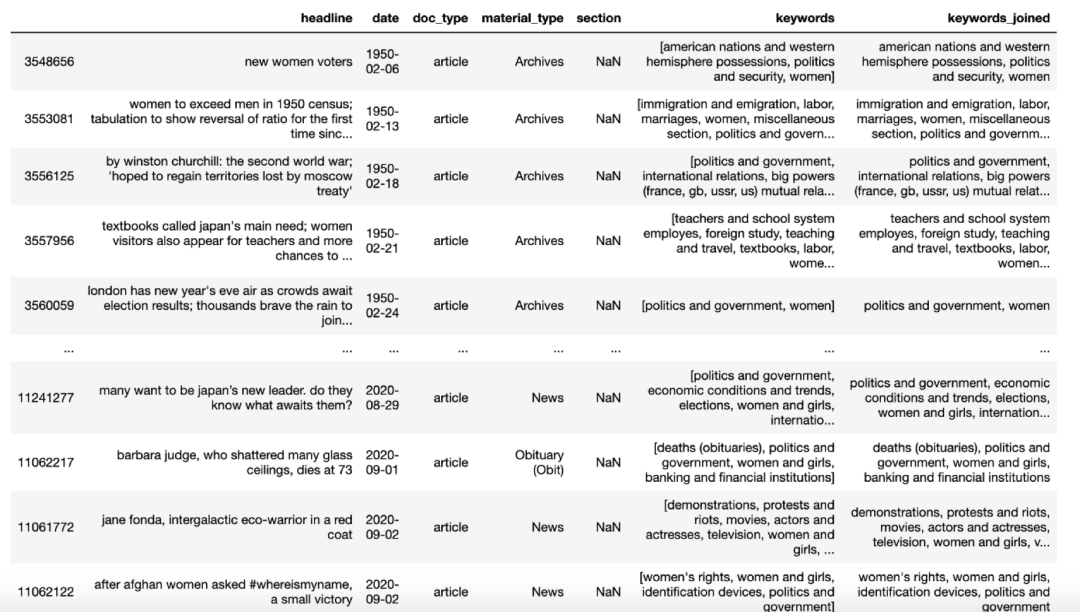
1950 – 至今:数据搜集与关键字分析
import picklewith open('frame_all.pickle', 'wb') as to_write:pickle.dump(frame, to_write)
with open('frame_all.pickle', 'rb') as read_file:df = pickle.load(read_file)
df['date'] = pd.to_datetime(df['date'])df = df[df['headline'].notna()].drop_duplicates().sort_values(by='date')df.dropna(axis=0, subset=['keywords'], inplace = True)
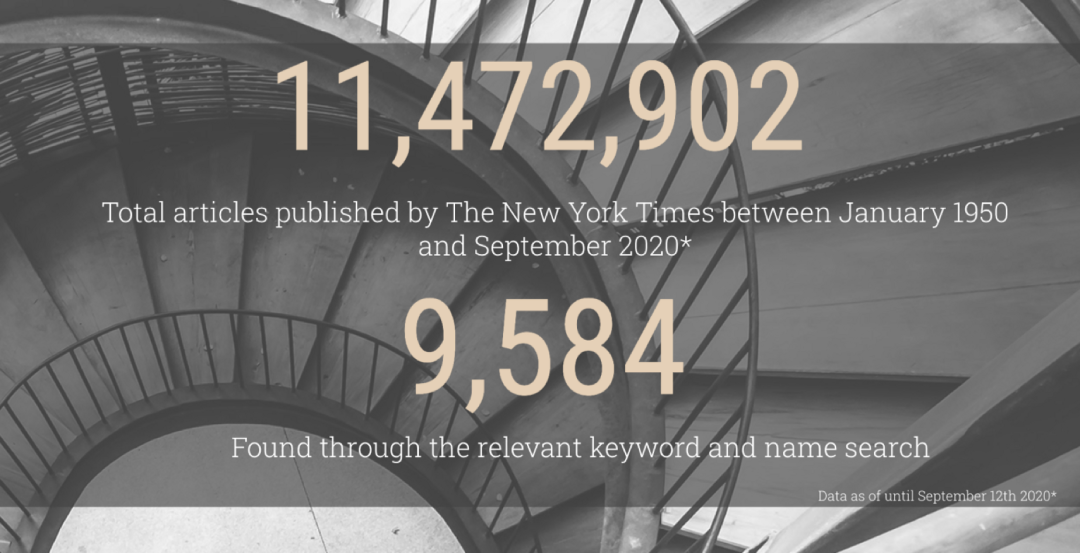
import astdf.keywords = df.keywords.astype(str).str.lower().transform(ast.literal_eval)keyword_counts = pd.Series(x for l in df['keywords'] for x in l).value_counts(ascending=False)len(keyword_counts)58,298 unique keywords.
project_keywords1 = [x for x in keyword_counts.keys() if 'women in politics' in xor 'businesswoman' in xor 'female executive' in xor 'female leader' in xor 'female leadership' in xor 'successful woman' in xor 'female entrepreneur' in xor 'woman entrepreneur' in xor 'women in tech' in xor 'female technology' in xor 'female startup' in xor 'female founder' in x ]
df['headline'] = df['headline'].astype(str).str.lower()Examine the headlines that contain words like woman, politics and power:wip_headlines = df[df['headline'].str.contains(('women' or 'woman' or 'female')) & df['headline'].str.contains(('politics' or 'power' or 'election'))]‘wip’ stands for ‘women in politics’.Our search returned only 185 headlines. Let’s look at the keywords to supplement that.df['keywords'].dropna()df['keywords_joined'] = df.keywords.apply(', '.join)df['keywords_joined'] = df['keywords_joined'].astype(str)import rewip_keywords = df[df['keywords_joined'].str.contains(r'(?=.*women)(?=.*politics)',regex=True)]
wip_df = pd.concat([wip_headlines, wip_keywords], axis=0, sort = True)
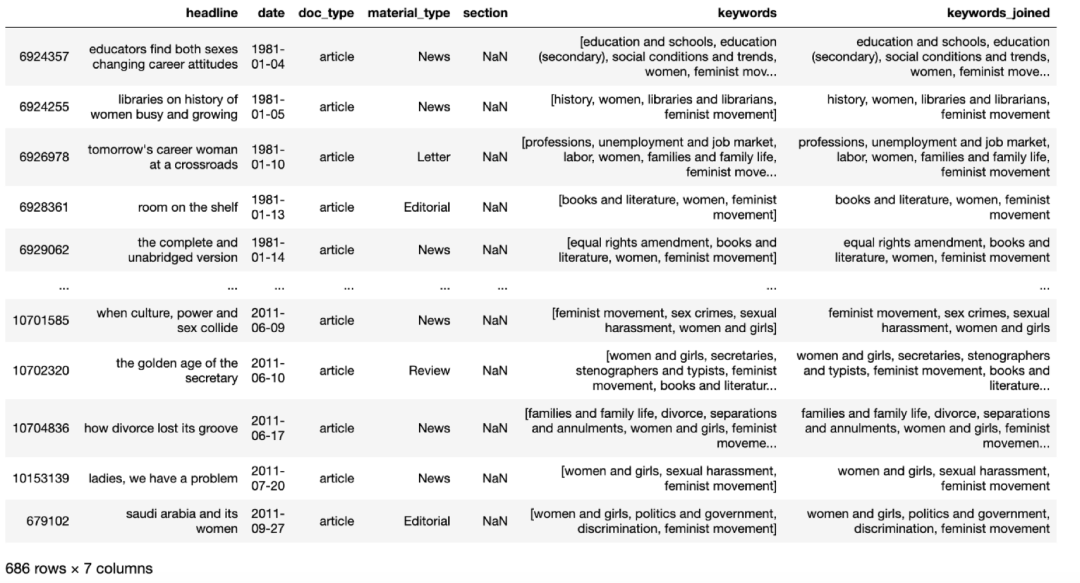
feminist_keywords = df[df['keywords_joined'].str.contains(r'(?=.*women)(?=.*feminist)',regex=True)]
#metoo movement:metoo_keywords = df[df['keywords_joined'].str.contains(r'(?=.*women)(?=.*metoo)(?=.*movement)',regex=True)]
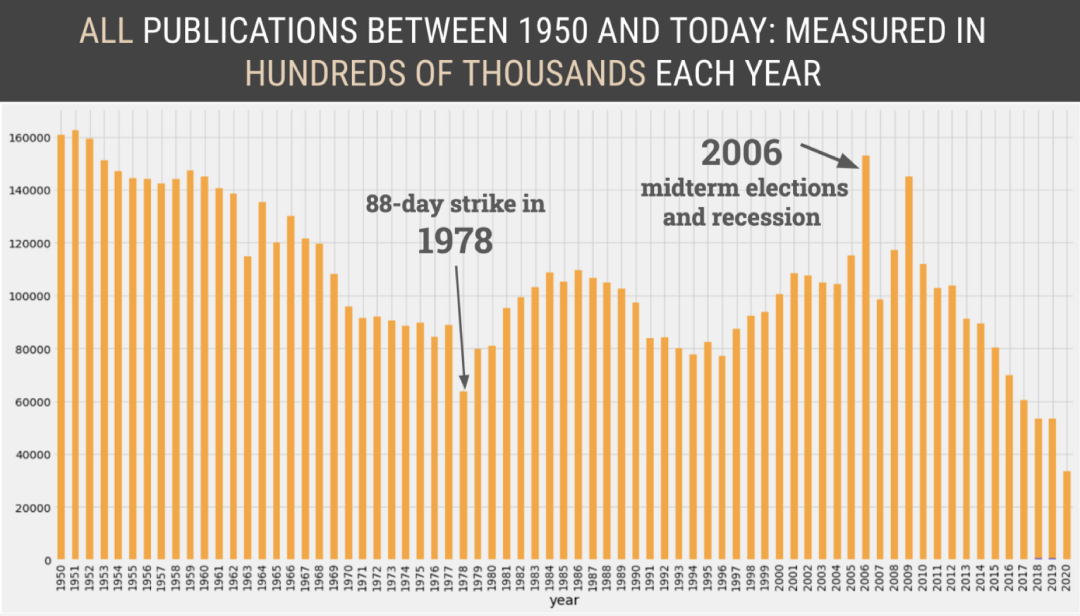
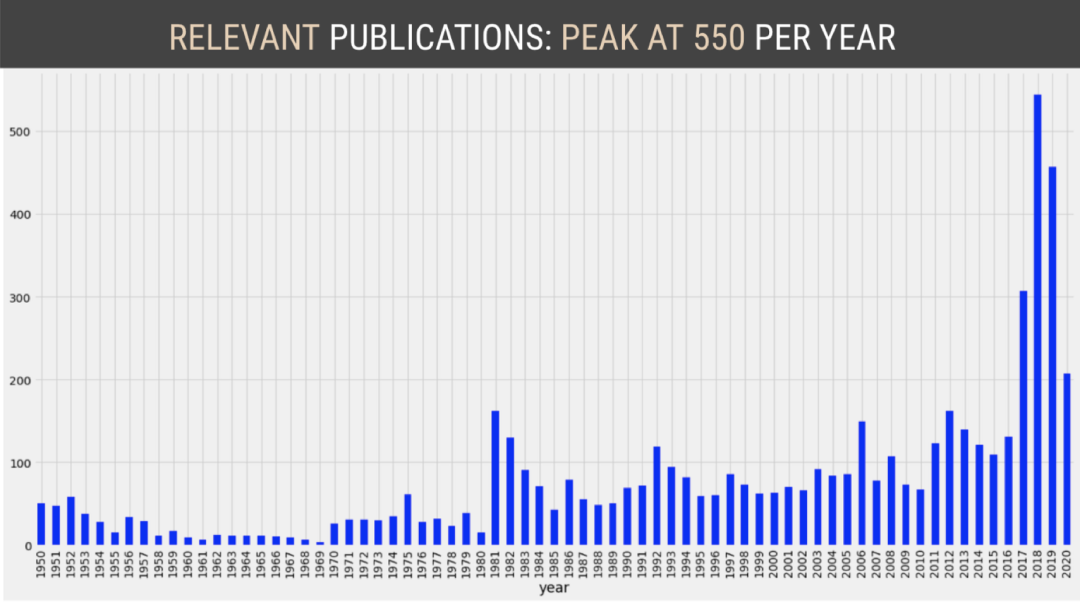
ax = df.groupby(df.date.dt.year['headline'].count().plot(kind='bar', figsize=(20, 6))ax.set(xlabel='Year', ylabel='Number of Articles')ax.yaxis.set_tick_params(labelsize='large')ax.xaxis.label.set_size(18)ax.yaxis.label.set_size(18)ax.set_title('Total Published Every Year', fontdict={'fontsize': 24, 'fontweight': 'medium'})plt.show()ax = project_df.groupby('year')['headline'].count().plot(kind='bar', figsize=(20, 6))ax.set(xlabel='Year', ylabel='Number of Articles')ax.yaxis.set_tick_params(labelsize='large')ax.xaxis.label.set_size(18)ax.yaxis.label.set_size(18)ax.set_title('Articles About Strong Women (based on relevant keywords) Published Every Year', \fontdict={'fontsize': 20, 'fontweight': 'medium'})plt.show()
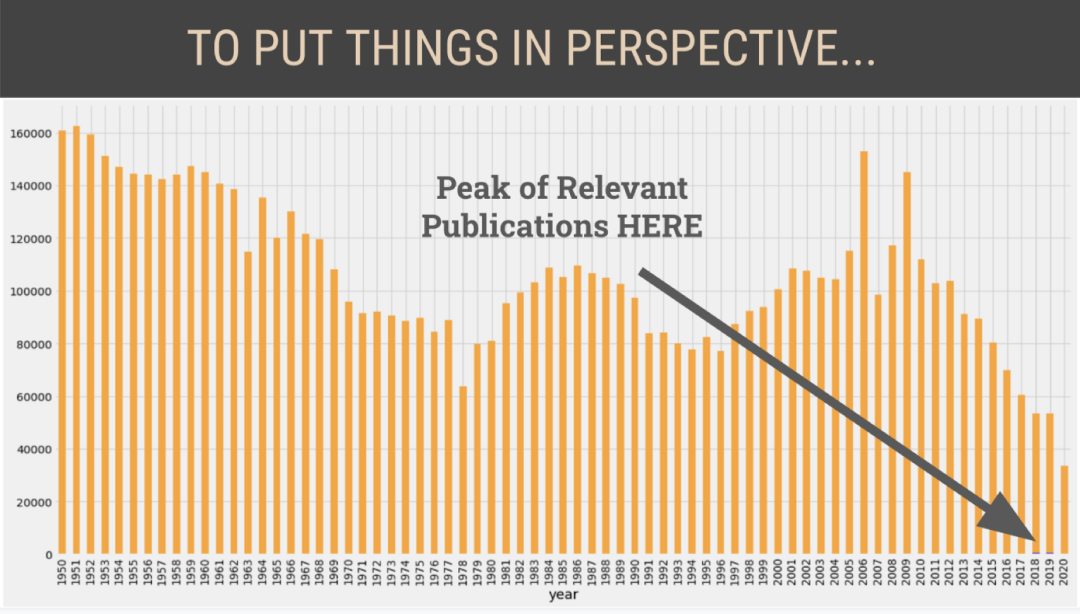

这些剪报是通过TimesMachine(纽约时报出版物档案)获得的。图片是由作者使用这些剪报创造的。
N-grams,Wordcloud以及情感分析
from sklearn.feature_extraction.text import CountVectorizerword_vectorizer = CountVectorizer(ngram_range=(1,3), analyzer='word')sparse_matrix = word_vectorizer.fit_transform(corpus)frequencies = sum(sparse_matrix).toarray()[0]ngram_df_project = pd.DataFrame(frequencies, index=word_vectorizer.get_feature_names(), columns=['frequency'])from wordcloud import WordCloud, STOPWORDSall_headlines = ' '.join(project_df['headline'].str.lower())stopwords = STOPWORDSstopwords.add('will')# Note: you can append your own stopwords to the existing ones.wordcloud = WordCloud(stopwords=stopwords, background_color="white", max_words=1000, width = 480, height = 480).\generate(all_headlines)plt.figure(figsize=(20,10))plt.imshow(wordcloud)plt.axis("off");

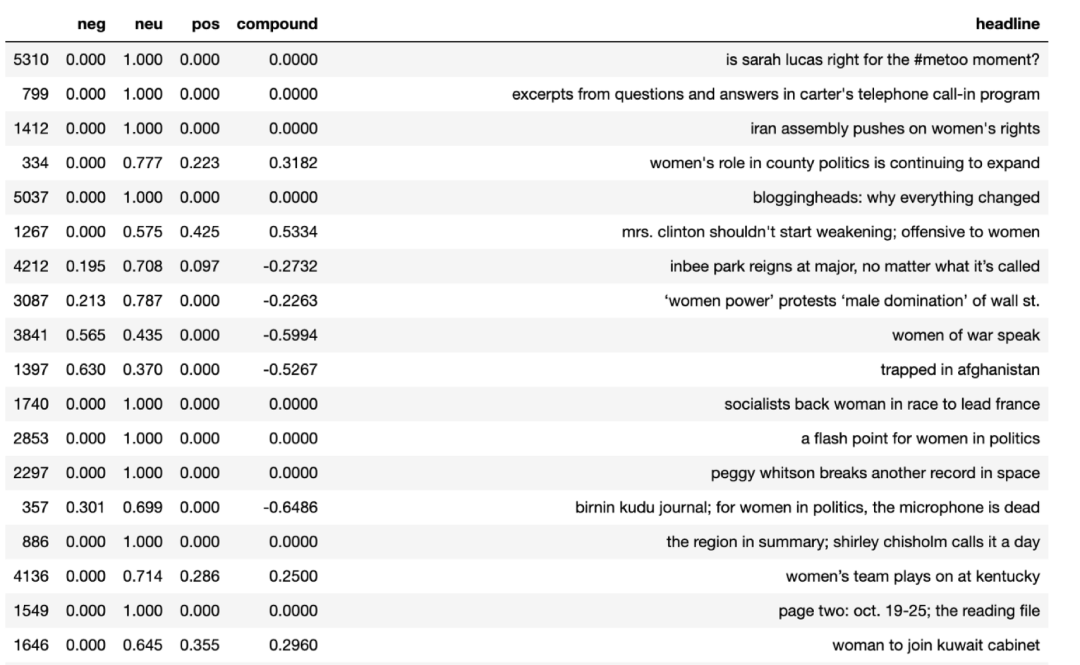
import nltknltk.download('vader_lexicon')from nltk.sentiment.vader import SentimentIntensityAnalyzer as SIAsia = SIA()results = []for line in project_df.headline:pol_score = sia.polarity_scores(line)pol_score['headline'] = lineresults.append(pol_score)print(results[:3])Output:[{'neg': 0.0, 'neu': 0.845, 'pos': 0.155, 'compound': 0.296, 'headline': 'women doctors join navy; seventeen end their training and are ordered to duty'}, {'neg': 0.18, 'neu': 0.691, 'pos': 0.129, 'compound': -0.2732, 'headline': 'n.y.u. to graduate 21 women doctors; war gave them, as others, an opportunity to enter a medical school'}, {'neg': 0.159, 'neu': 0.725, 'pos': 0.116, 'compound': -0.1531, 'headline': 'greets women doctors; dean says new york medical college has no curbs'}]Sentiment as a dataframe:sentiment_df = pd.DataFrame.from_records(results)
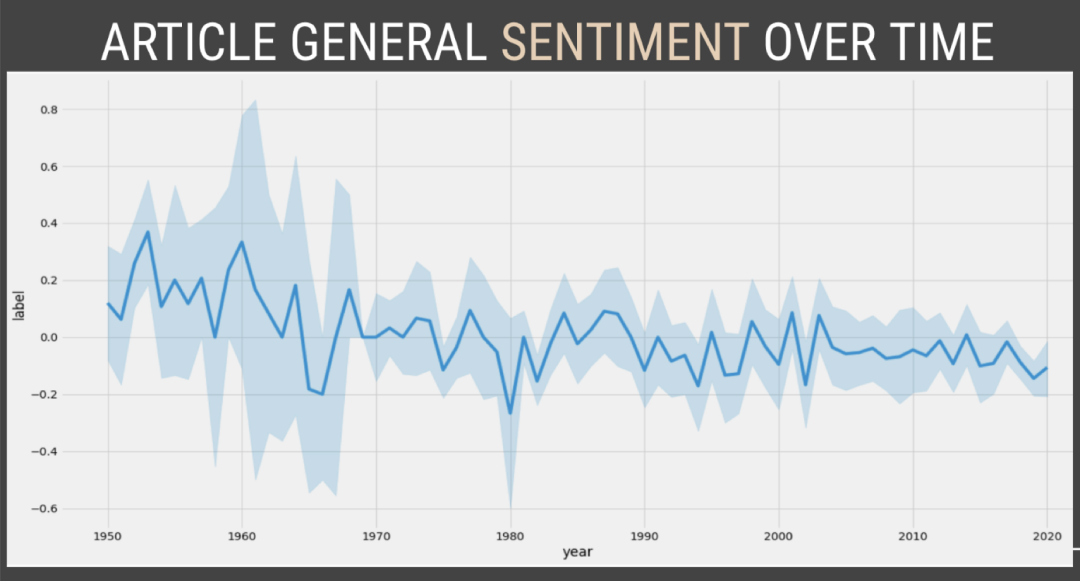
dates = project_df['year']sentiment_df = pd.merge(sentiment_df, dates, left_index=True, right_index=True)The code above allows us to have a timeline for our sentiment. To simplify the sentiment analysis, we are going to create some new categories for positive, negative and neutral.sentiment_df['label'] = 0sentiment_df.loc[sentiment_df['compound'] > 0.2, 'label'] = 1sentiment_df.loc[sentiment_df['compound'] < -0.2, 'label'] = -1sentiment_df.head()To visualize overall sentiment distribution:sentiment_df.label.value_counts(normalize=True) * 100
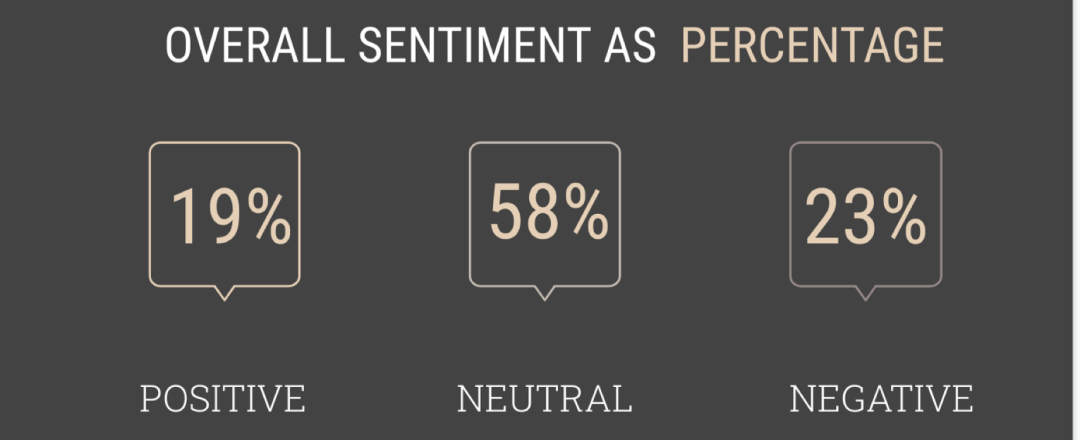
图片由作者产生,Slidesgo模板
sns.lineplot(x="year", y="label", data=sentiment_df)plt.show()
结论
实习/全职编辑记者招聘ing
加入我们,亲身体验一家专业科技媒体采写的每个细节,在最有前景的行业,和一群遍布全球最优秀的人一起成长。坐标北京·清华东门,在大数据文摘主页对话页回复“招聘”了解详情。简历请直接发送至zz@bigdatadigest.cn