
【牛】将 Pandas 转换为交互式表格的 Python 库
Pivottablejs
pivot_ui函数可以自动从DataFrame生成交互式用户界面,使用户可以简单地修改,检查聚合项,并快速轻松地更改数据结构。
     !pip install pivottablejs


 from pivottablejs import pivot_ui


 import pandas as pd


 data = pd.read_csv("D:\Data\company_unicorn.csv")


 data["Year"] = pd.to_datetime(data["Date Joined"]).dt.year


 pivot_ui(data)
如下图所示,我们可以直接在notebook中对DataFrame进行筛选,生成图表
我们还可以快速生成数据透视表
Pygwalker
PyGWalker可以把DataFrame变成一个表格风格的用户界面,让我们直观有效地探索数据。
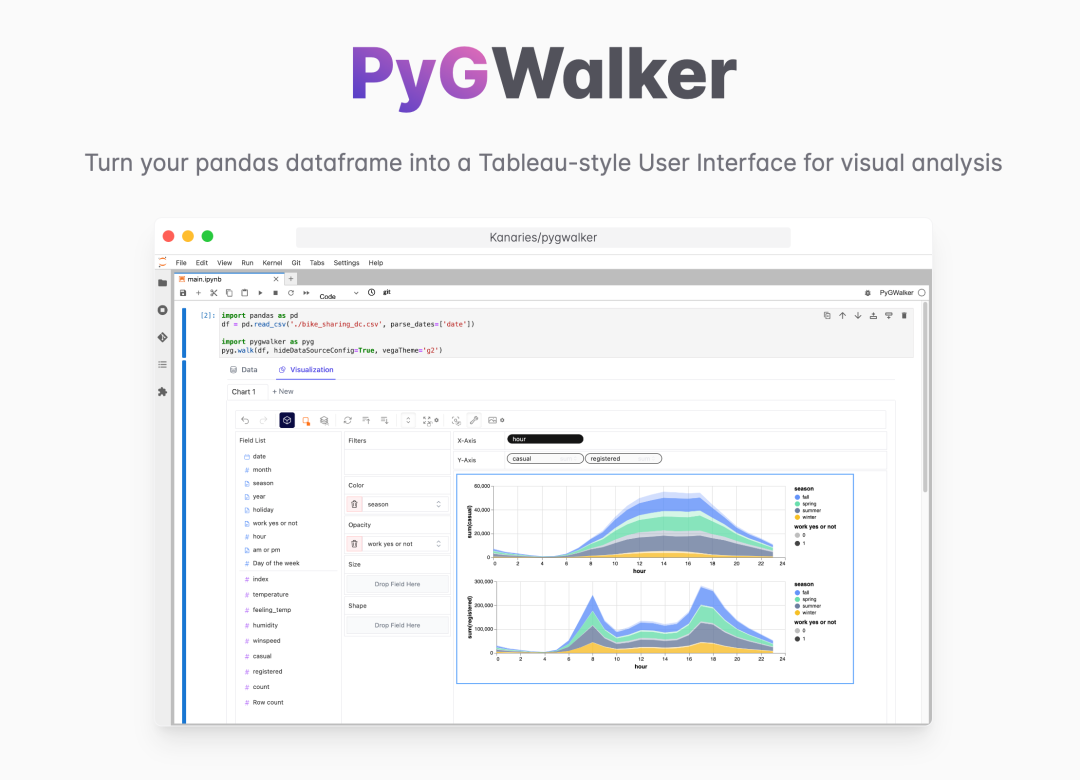
这个包的用户界面对Tableau用户来说很熟悉,如果你用过Tableau那么上手起来就很容易
     !pip install pygwalker


 import pygwalker as pyw


 walker = pyw.walk(data)
img
通过一些简单的拖拽,可以进行筛选和可视化,这是非常方便的
Qgrid
除了PyGWalker之外,Qgrid也是一个很好的工具,它可以很容易地将DataFrame架转换为视觉上直观的交互式数据表。
     import qgrid


 qgridframe = qgrid.show_grid(data, show_toolbar=True)


 qgridframe
我们还可以直接在表上添加、删除数据
Itables
与上面提到的qgrid包一样,Itables提供了一个简单的接口。可以进行简单的操作,如过滤、搜索、排序等。
     from itables import init_notebook_mode, show


 init_notebook_mode(all_interactive=False)


 show(data)
tables和Qgrid包对于快速查看数据模式是必要的。然而,如果我们想要进一步理解数据并进行数据转换,它们的特征是不够的。因此,在获得更复杂的见解的情况下,使用透视表js和Pygwalker是可取的。
总结
上面的这些包可以在Jupyter Notebook中将dataframe转换为交互式表。
Itables 和Qgrid比较轻量,可以让我们快速的查看数据,但是如果你想进行更多的操作,例如生成一些简单的可视化图表,那么Pivottablejs和Pygwalker是一个很好的工具。
评论