
使用NSX高级负载均衡度量值水平扩缩(HPA)容器实例
tags: Avi

序
承接上一篇, 使用NSX高级负载均衡(以下简称ALB)度量值触发后端虚拟机池水平扩缩, 本篇讲讲容器环境中使用ALB度量值触发容器的水平扩缩(HPA: Horizontal Pod Autoscaler). 我们的目标是监控ALB上某个L7 VS(Virtual Service)或Pool的度量值, 当度量值达到某个预设值时, 触发HPA, 扩展Pod实例.
可行性方案
关于ALB度量值:
查询ALB文档
https://avinetworks.com/docs/20.1/avi-vantage-prometheus-integration/发现ALB很早就支持将控制器 / 虚拟服务(VS) / 后端池(Pool) / 服务引擎(SE or LB) 的各度量值以Prometheus格式暴露. 文档中也描述了抓取的API路径和方法, 另外所有的度量值分类都在Metrics List文档中有详细描述:
https://avinetworks.com/docs/20.1/metrics-list/#vmware-metrics关于HPA:
查询HPA文档, 发现HPA V1并不支持自定义度量值, 只能通过Metrics-Server提供的CPU / Men使用率来做水平扩缩策略. 但文档中有提到HPA V2beta2可以支持custom.metrics & external.metrics. 那么我们的思路就变成了, 如果使用Prometheus将抓取的ALB度量值暴露到K8s的custom.metrics中去, 让HPA V2beta2查询到.
关于Prometheus: 经过一轮搜索, 得知了Prometheus Adapter这个项目可以将Prometheus抓取的度量值暴露在custom.metrics & external.metrics. 该项目描述如下:
This repository contains an implementation of the Kubernetes resource metrics, custom metrics, and external metrics APIs.
This adapter is therefore suitable for use with the autoscaling/v2 Horizontal Pod Autoscaler in Kubernetes 1.6+. It can also replace the metrics server on clusters that already run Prometheus and collect the appropriate metrics.
另外还好社区里有kube-prometheus这样的项目来简化安装与集成, 同时可以使用Prometheus Operator来简化配置Prometheus抓取配置.(不然我可能坚持不下去, 原生的抓取规则看了一眼就头大.)
逻辑导图
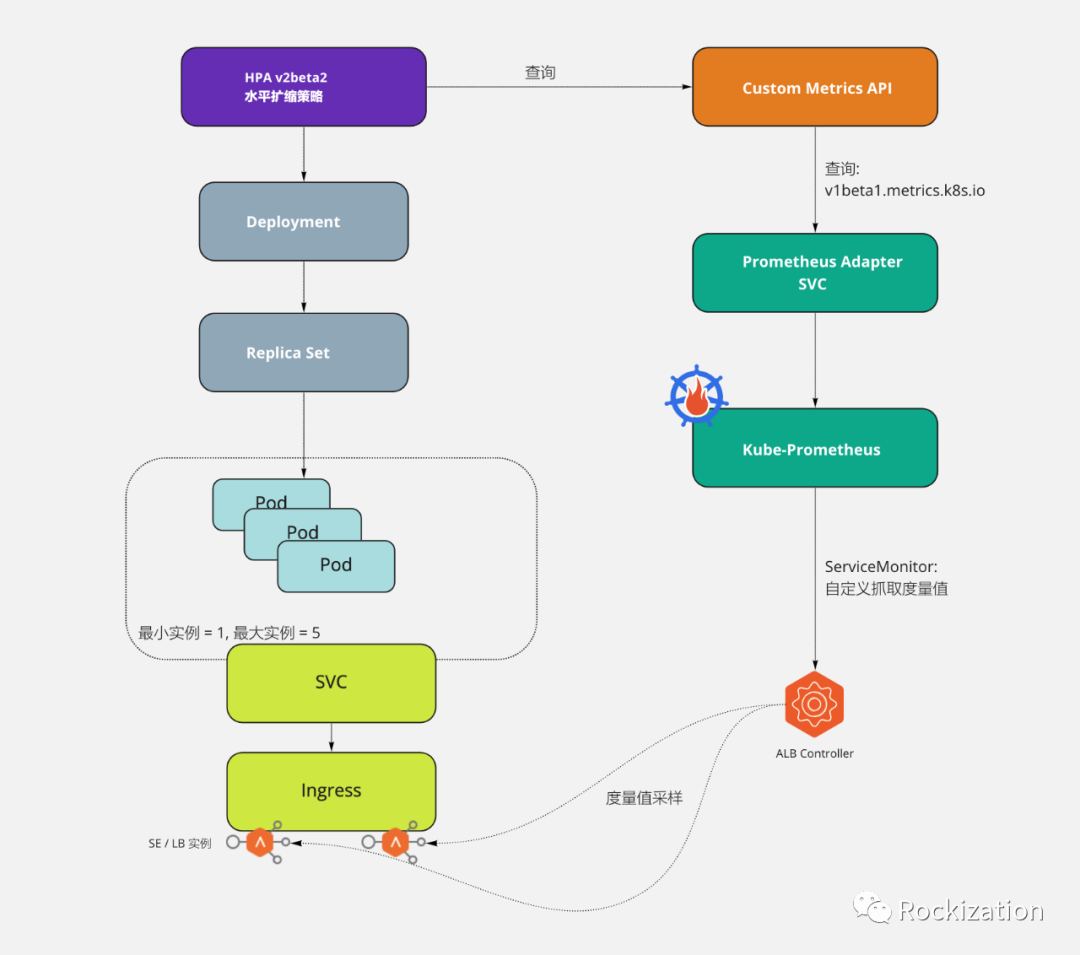
ALB承担K8s集群负载均衡(LB)和服务入口(Ingress)
ALB默认对服务引擎(SE)进行度量值采样, 并以Prometheus格式暴露
ALB设置为基本认证模式, 方便Prometheus使用用户名密码认证后抓取度量值
制作ServiceMonitor(Prometheus Opretor的CRD)配置Prometheus抓取参数, 如认证, 目标地址, 度量值, 间隔等.
查看v1beta1.metrics.k8s.io, 检查Prometheus Adapter是否成功暴露自定义度量值
制作HPA, 预设扩缩阀值
压力测试
测试拓扑
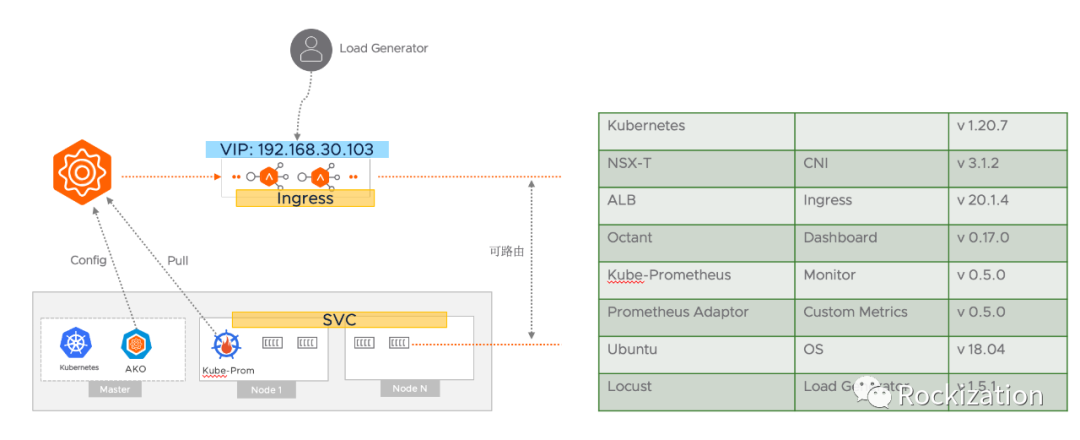
特点:
使用NSX-T作为CNI, 为容器提供可路由环境. 服务引擎(SE)路由可达Pod避免了Kube-Proxy SNAT的参与, 更好的健康检测.
AKO(ALB K8s Operator)监听K8s集群内LB和Ingress的请求, 自动配置服务引擎实现发布.
准备工作
CNI当然推荐NSX-T, 毕竟Pod可路由省去很多麻烦. 如果觉得NSX-T集成有难度可以考虑使用VMware开源CNI Antrea, 独有的NodeportLocal也能很好的规避Kube-Proxy的NAT, 也能实现LB对Pod的健康检查(可以考虑下篇做个简短的Demo).
安装K8s(废话)
安装AKO:
https://avinetworks.com/docs/ako/1.4/ako-installation/配置ALB控制器API采用基础认证:
https://avinetworks.com/docs/20.1/http-basic-auth-for-api-queries/安装Prometheus Operator:
https://github.com/prometheus-operator/prometheus-operatorhttps://mp.weixin.qq.com/s/vUsi4OrVopav46QHEBDNsA
集成过程相当折磨, Prometheus体系也是很大的, 还好Operator对其操作做了简化. 过程需要趟坑的话欢迎小窗.
配置环节
找一个你喜欢的Web应用发布成Ingress, SVC Type LB也行. 我使用的是Kuard.
root@ubuk8s-c3-vm01:/# kubectl get ingress -n routing-ns1
NAME            CLASS    HOSTS                       ADDRESS          PORTS   AGE
kuard-ingress   <none>   kuard.nsx.rockhomelab.org   192.168.30.103   80      13d
ALB相应后获得VIP: 192.168.30.103, 可以在ALB控制器界面中确认. 同时也可以发现, 后端池成员就是Pod IP.
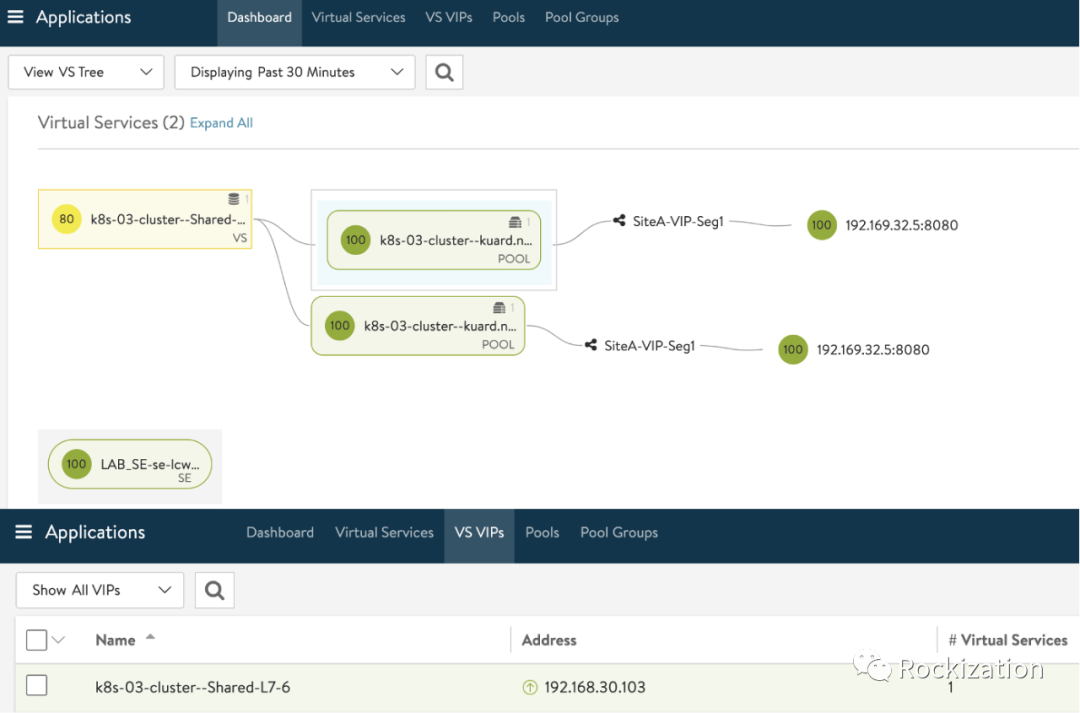
获取目标Pool Name. 其实这一步也可以直接用VS Name, 但当时我没有设置每个Ingress生成独立的VS, 所以就选择了用Pool级别的度量值.
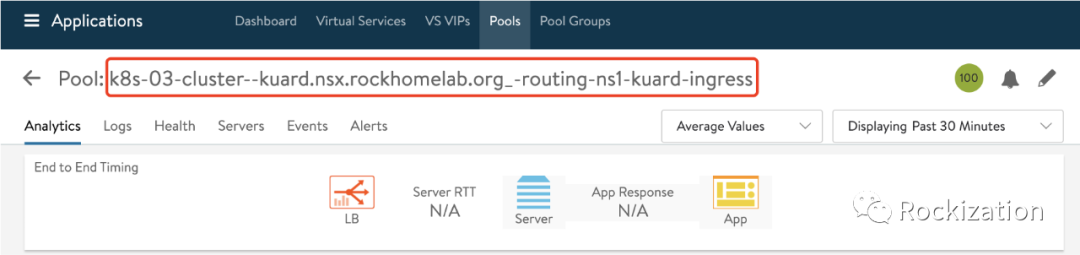
然后配置Prometheus抓取该Pool的度量值, 我这里选择了Pool级别的度量值: l4_server.avg_open_conns.
制作伪SVC: avilb, 与发布的Pod在同一Namespace. 手工为伪SVC添加Endpoint, 即ALB控制器地址
apiVersion: v1
kind: Service
metadata:
  labels:
    lbaas: avi
  name: avilb
  namespace: routing-ns1
spec:
  clusterIP: None
  ports:
  - name: metrics
    port: 443
    targetPort: 443
  selector: null

---
apiVersion: v1
kind: Endpoints
metadata:
  labels:
    lbaas: avi
  name: avilb
  namespace: routing-ns1
subsets:
- addresses:
  - ip: 192.168.31.246
  ports:
  - name: metrics
    port: 443
    protocol: TCP
制作完后可以查询确认: SVC中selector为空时, 会选择与SVC名字一样的Endpoint作为成员.
root@ubuk8s-c3-vm01:/# kubectl get svc -n routing-ns1
NAME            TYPE        CLUSTER-IP       EXTERNAL-IP   PORT(S)   AGE
avilb           ClusterIP   None             <none>        443/TCP   16d
kuard-service   ClusterIP   10.100.172.103   <none>        80/TCP    16d
root@ubuk8s-c3-vm01:/# kubectl get endpoints -n routing-ns1
NAME            ENDPOINTS            AGE
avilb           192.168.31.246:443   16d
kuard-service   192.169.32.5:8080    16d
root@ubuk8s-c3-vm01:/#
制作Secret, 写入ALB控制器用户名密码, 待会Prometheus抓取时需要:
kubectl create secret -n routing-ns1 generic avi-basic-auth --from-literal=username='admin' --from-literal=password='VMware1!VMware1!'
制作ServiceMonitor
apiVersion: monitoring.coreos.com/v1
kind: ServiceMonitor
metadata:
  name: avilb-servicemonitor
  namespace: routing-ns1
  labels:
    lbaas: avi # This is what the prometheus1 CR looking for match
spec:
  endpoints:
  - path: '/api/analytics/prometheus-metrics/pool/'
    params:
      entity_name:
        - k8s-03-cluster--kuard.nsx.rockhomelab.org_-routing-ns1-kuard-ingress
      metric_id:
        - l4_server.avg_open_conns
    scheme: https
    port: metrics
    tlsConfig:
      insecureSkipVerify: true
    basicAuth:
      password:
        name: avi-basic-auth
        key: password
      username:
        name: avi-basic-auth
        key: username
  jobLabel: lbaas
  namespaceSelector:
    matchNames:
    - routing-ns1
  selector:
    matchLabels:
      lbaas: avi
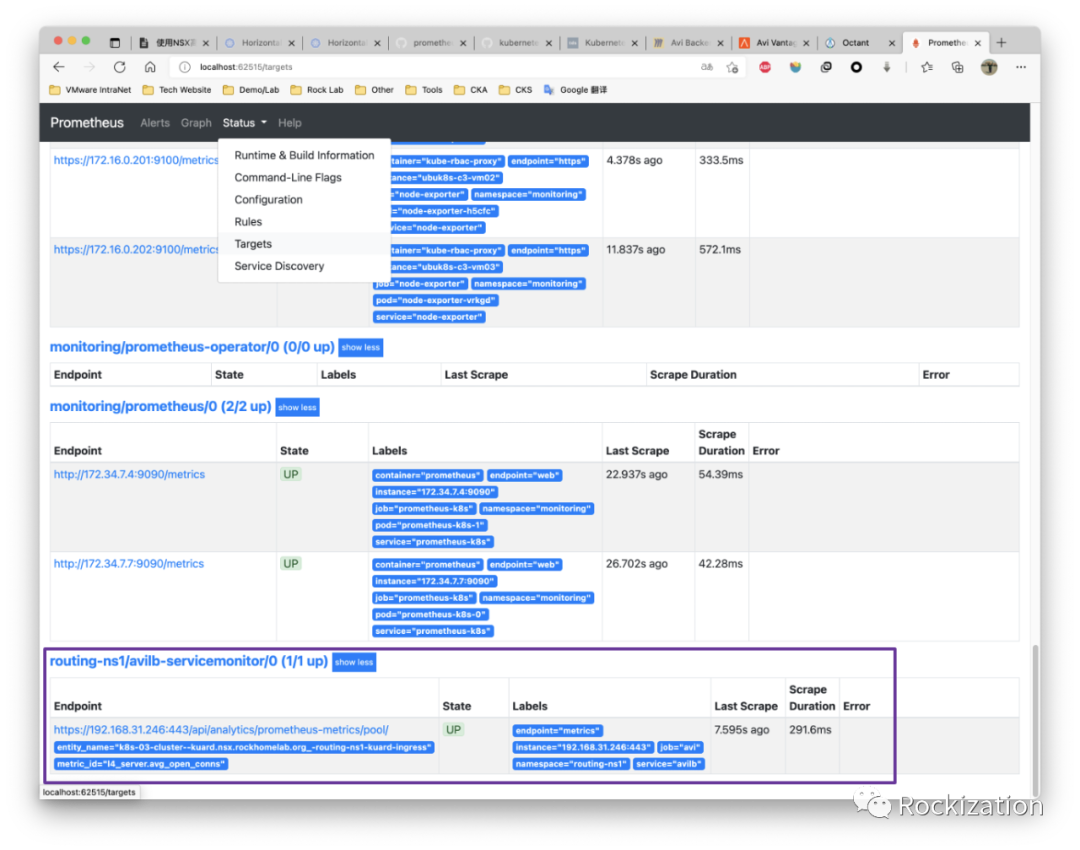
登录到Prometheus, 在Targets中查看自定义抓取的ALB度量值状态是否正常. 可选将该度量值图表添加到Grafana中.
确保Prometheus Adaptor 已经将该自定义度量值暴露了在 custom.metrics.k8s.io/v1beta1中, 使用kubectl get --raw来验证. 由于Prometheus的时区是UTC0, 并且是Hard code在程序里的, 显示的时间戳会有8小时“时差”. Grafana中可以在UI中设置本地时区, 可以解决现实问题.
kubectl get --raw="/apis/custom.metrics.k8s.io/v1beta1/namespaces/routing-ns1/services/avilb/avi_l4_server_avg_open_conns/" |jq
{
  "kind": "MetricValueList",
  "apiVersion": "custom.metrics.k8s.io/v1beta1",
  "metadata": {
    "selfLink": "/apis/custom.metrics.k8s.io/v1beta1/namespaces/routing-ns1/services/avilb/avi_l4_server_avg_open_conns/"
  },
  "items": [
    {
      "describedObject": {
        "kind": "Service",
        "namespace": "routing-ns1",
        "name": "avilb",
        "apiVersion": "/v1"
      },
      "metricName": "avi_l4_server_avg_open_conns",
      "timestamp": "2021-05-30T05:54:25Z",
      "value": "0"
    }
  ]
}
制作HPA
根据文档提供的水平扩展的公式:
期望副本数 = ceil[当前副本数 * (当前指标 / 期望指标)]
我们将期望指标设置在200, Pod副本最大扩展到5个.
apiVersion: autoscaling/v2beta2
kind: HorizontalPodAutoscaler
metadata:
  name: hpa-kuard-l4metric
  namespace: routing-ns1
spec:
  maxReplicas: 5
  minReplicas: 1
  scaleTargetRef:
    apiVersion: apps/v1
    kind: Deployment
    name: kuard-deployment
  metrics:
    - type: Object
      object:
        metric:
          name: avi_l4_server_avg_open_conns
        describedObject:
          apiVersion: v1
          kind: Service
          name: avilb
        target:
          type: Value
          value: 200
HPA是Namespace级别的对象, 所以刚才在制作伪SVC时也要放在相同的Namespace内.
压测
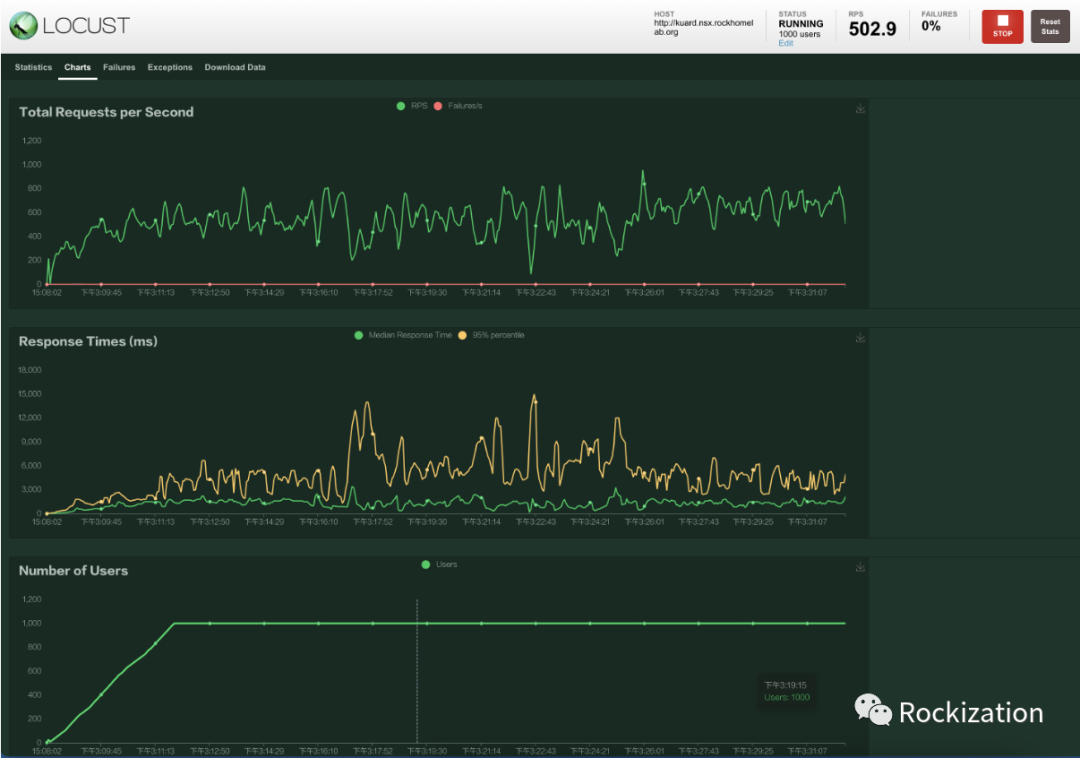
还是请出我们的Locust, 模拟1000个用户连接访问VIP. 这次我们对比三个图形界面观察度量值变化. 压测从下午15:08分开始, 截止时间15:30分. 1000个Users, 每秒孵化5个.
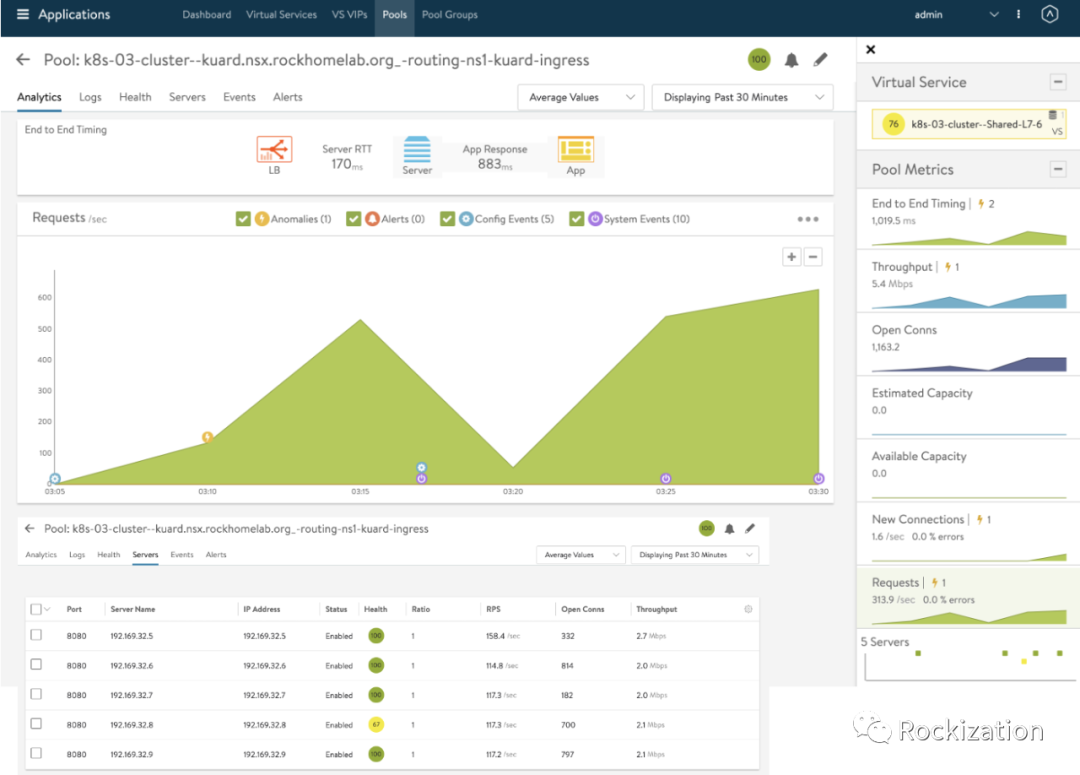
ALB控制界面, Pod实例扩展到5个, 轮询模式接受连接.
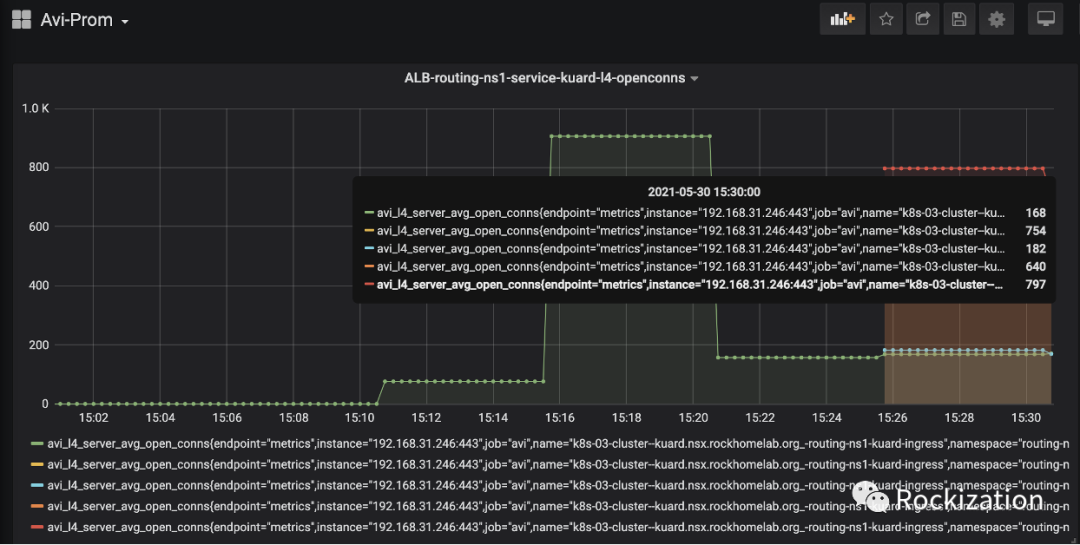
Grafana界面清楚的现实, 最开始只有一个Pod, 当HPA生效后, 5个Pod的度量值为该Pool L4 Open Connection的总值.
查看HPA所在的Namespace可以观察到事件的触发过程.
32m         Normal    SuccessfulCreate               replicaset/kuard-deployment-5c55bf6c         Created pod: kuard-deployment-5c55bf6c-jnxzv
32m         Normal    SuccessfulCreate               replicaset/kuard-deployment-5c55bf6c         Created pod: kuard-deployment-5c55bf6c-khzqt
32m         Normal    SuccessfulCreate               replicaset/kuard-deployment-5c55bf6c         Created pod: kuard-deployment-5c55bf6c-78csp
31m         Normal    SuccessfulCreate               replicaset/kuard-deployment-5c55bf6c         Created pod: kuard-deployment-5c55bf6c-hndwq
2m15s       Normal    SuccessfulDelete               replicaset/kuard-deployment-5c55bf6c         Deleted pod: kuard-deployment-5c55bf6c-78csp
2m15s       Normal    SuccessfulDelete               replicaset/kuard-deployment-5c55bf6c         Deleted pod: kuard-deployment-5c55bf6c-jnxzv
2m15s       Normal    SuccessfulDelete               replicaset/kuard-deployment-5c55bf6c         Deleted pod: kuard-deployment-5c55bf6c-hndwq
2m15s       Normal    SuccessfulDelete               replicaset/kuard-deployment-5c55bf6c         Deleted pod: kuard-deployment-5c55bf6c-khzqt
2m15s       Normal    ScalingReplicaSet              deployment/kuard-deployment                  Scaled down replica set kuard-deployment-5c55bf6c to 1
32m         Normal    ScalingReplicaSet              deployment/kuard-deployment                  Scaled up replica set kuard-deployment-5c55bf6c to 4
31m         Normal    ScalingReplicaSet              deployment/kuard-deployment                  Scaled up replica set kuard-deployment-5c55bf6c to 5
ALB默认5分钟汇报一次度量值(可调,最高到实时), Prometheus每30s抓取一次(在ServiceMonitor中可调整), HPA默认冷却时间5分钟.
小结
由于篇幅的问题, 准备环境环节省略了很多过程, 实际上安装与集成的步骤有官方文档和大拿们的分享贴, 有兴趣复制该实验的同学可以搜来参考一下.
或者科学上网搜索Custom Metrics HPA也有可以参考的文章. 这些文章大多会提供一个Demo App, 该Demo App自己提供度量值然后被Prometheus抓取, 逻辑跟本文一样, 通过Adaptor提供API在被HPA查询到.
让业务应用自己输出度量值(兼容Prometheus格式)也许对于研发来说并不是难事, 也许是我站着说话不腰疼. 总体来说暴露什么样的度量值和怎么使用都需要系统的规划, 对于运维体系来说事情可大可小. 对于通过负载均衡暴露的业务来说, 除CPU/MEN外的指标外, L4/L7的指标由负载均衡器来汇报更为科学. 当然了由业务应用汇报度量值又可以更为灵活, 可以匹配业务逻辑. 可以综合使用, 比如水平扩缩采用负载均衡汇报的度量值, 业务运维统计则使用App开发时定制的度量值, 相得益彰.
Prometheus自成体系, 周边的生态也很多, 学来不易. 折射出运维管理是门大学问, 致敬每一位运维人.