
Vue3+Element+Echarts 绘制统计图表
近期有需求要按照小时、月份、季度、年份做数据统计柱状图和折线图
echarts开发文档:
https://echarts.apache.org/handbook/zh/get-started/
首先需要引入echarts.js
          <script src="https://cdn.jsdelivr.net/npm/echarts@5.4.2/dist/echarts.min.js">

          </script>
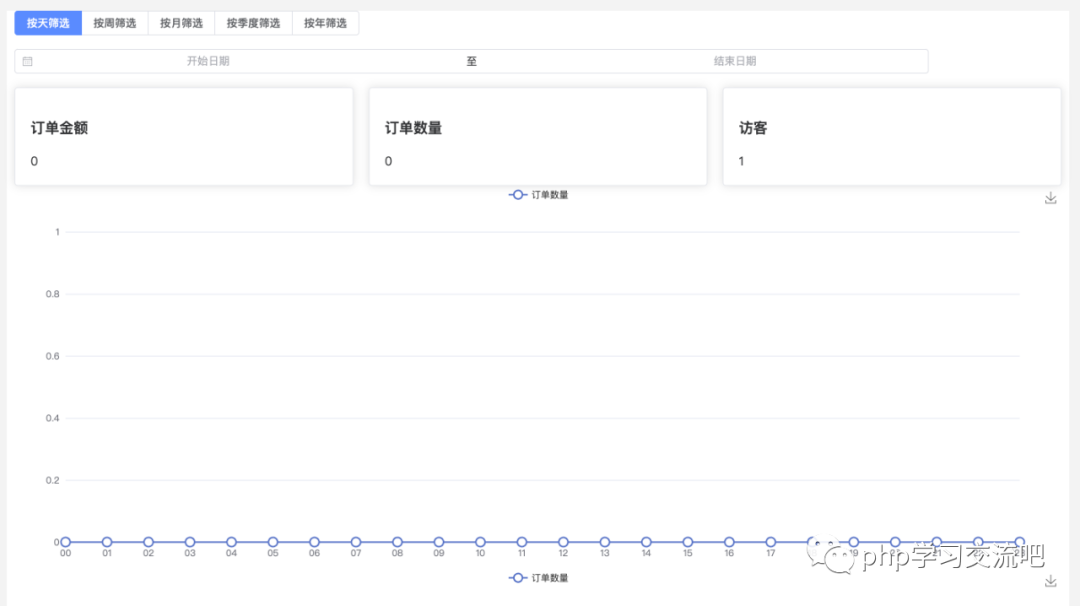
效果图:
柱状图js部分代码:
        appConfig.components['views/components/BarHeapChart'] = Vue.defineComponent({


          // 在 JavaScript 中是 camelCase 的


          props: {


            className: {


              type: String,


              default: 'chart'


            },


            width: {


              type: String,


              default: '100%'


            },


            height: {


              type: String,


              default: '500px'


            },


            xAxisData: {


              type: Array,


              default: () => {


                return ['Mon', 'Tue', 'Wed', 'Thu', 'Fri', 'Sat', 'Sun']


              }


            },


            seriesData: {


              type: Array,


              default: () => {


                return [{


                  type: 'bar',


                  smooth: true,


                  data: [820, 932, 901, 934, 1290, 1330, 1320],


                }]


              }


            }


          },


          watch: {


            xAxisData: {


              deep: true,


              handler(val) {


                this.xAxisData = val


              }


            },


            seriesData: {


              deep: true,


              handler(val) {


                this.seriesData = val


                this.disposeChart()


                this.initChart()


              }


            }


          },


          data: function() {


            return {


              chart: null


            }


          },


          mounted: function() {


            this.$nextTick(() => {


              this.initChart()


            })


          },


          beforeDestroy() {


            this.disposeChart()


          },


          computed: {


          },


          methods: {


            disposeChart() {


              if (!this.chart) {


                return


              }


              this.chart.dispose()


              this.chart = null


            },


            initChart() {


              this.chart = echarts.init(this.$el, 'roma')


              this.drawChart()


            },


            drawChart() {


              this.chart.setOption({


                tooltip: {


                  trigger: 'axis',


                  axisPointer: {


                    type: 'cross',


                    label: {


                      backgroundColor: '#6a7985'


                    }


                  }


                },


                legend: {


                  left: 'center'


                },


                toolbox: {


                  feature: {


                    saveAsImage: {}


                  }


                },


                grid: {


                  left: '3%',


                  right: '4%',


                  bottom: '3%',


                  containLabel: true


                },


                xAxis: [{


                  type: 'category',


                  boundaryGap: false,


                  data: this.xAxisData


                }],


                yAxis: [{


                  type: 'value'


                }],


                series: this.seriesData


              })


            }


          },


          template: `


        <div :class="className" :style="{minHeight:height,width:width}"/>


        `


        })
折线图js部分代码:
        appConfig.components['views/components/LineHeapChart'] = Vue.defineComponent({


          // 在 JavaScript 中是 camelCase 的


          props: {


            className: {


              type: String,


              default: 'chart'


            },


            width: {


              type: String,


              default: '100%'


            },


            height: {


              type: String,


              default: '500px'


            },


            xAxisData: {


              type: Array,


              default: () => {


                return ['Mon', 'Tue', 'Wed', 'Thu', 'Fri', 'Sat', 'Sun']


              }


            },


            seriesData: {


              type: Array,


              default: () => {


                return [{


                  type: 'line',


                  smooth: true,


                  data: [820, 932, 901, 934, 1290, 1330, 1320],


                }]


              }


            }


          },


          watch: {


            xAxisData: {


              deep: true,


              handler(val) {


                this.xAxisData = val


              }


            },


            seriesData: {


              deep: true,


              handler(val) {


                this.seriesData = val


                this.disposeChart()


                this.initChart()


              }


            }


          },


          data: function() {


            return {


              chart: null


            }


          },


          mounted: function() {


            this.$nextTick(() => {


              this.initChart()


            })


          },


          beforeDestroy() {


            this.disposeChart()


          },


          computed: {


          },


          methods: {


            disposeChart() {


              if (!this.chart) {


                return


              }


              this.chart.dispose()


              this.chart = null


            },


            initChart() {


              this.chart = echarts.init(this.$el, 'roma')


              this.drawChart()


            },


            drawChart() {


              this.chart.setOption({


                tooltip: {


                  trigger: 'axis',


                  axisPointer: {


                    type: 'cross',


                    label: {


                      backgroundColor: '#6a7985'


                    }


                  }


                },


                legend: {


                  left: 'center'


                },


                toolbox: {


                  feature: {


                    saveAsImage: {}


                  }


                },


                grid: {


                  left: '3%',


                  right: '4%',


                  bottom: '3%',


                  containLabel: true


                },


                xAxis: [{


                  type: 'category',


                  boundaryGap: false,


                  data: this.xAxisData


                }],


                yAxis: [{


                  type: 'value'


                }],


                series: this.seriesData


              })


            }


          },


          template: `


        <div :class="className" :style="{minHeight:height,width:width}"/>


        `


        })
前端渲染代码:
        (function(){


            const importComponents = {


                'views/components/BarHeapChart':'BarHeapChart',


                'views/components/LineHeapChart':'LineHeapChart',


            };


            appConfig.components['views/index'] = autoLoadjs(Object.keys(importComponents)).then(function(){


                const components = {}


                Object.keys(importComponents).map(function(key){


                    components[importComponents[key]] = appConfig.components[key]


                })


                return Vue.defineComponent({


                components: components,


                data:function() {


                    return {


                        tableData: [],


                        listQuery:{


                            search_date:'',


                            date_mode:'day'


                        },


                    }


                },


                mounted:function() {


                    this.initData()


                },


                methods:{


                    initData:function(){


                        const that = this


                        //开启table加载效果


                        this.$network("/admin/index/echarts", this.listQuery,{


                            completeEvent:function(res){  }


                        }).then(function(res){


                            var data = res.data || {}


                            that.tableData = data


                        })


                    },


                },


                template : `


                    <el-row :gutter="20">


                        <el-col :span="21">


                            <el-form-item name="activeState">


                                 <el-radio-group v-model="listQuery.date_mode" fill="#5a8bff" @change="initData(true)">


                                    <el-radio-button label="day">按天筛选</el-radio-button>


                                    <el-radio-button label="week">按周筛选</el-radio-button>


                                    <el-radio-button label="month">按月筛选</el-radio-button>


                                    <el-radio-button label="month60">按季度筛选</el-radio-button>


                                    <el-radio-button label="year">按年筛选</el-radio-button>


                                </el-radio-group>


                            </el-form-item>


                         </el-col>


                         <el-col :span="21">


                            <el-form-item name="activeState">


                                 <el-date-picker


                                    type="daterange"


                                    value-format="YYYY-MM-DD"


                                    v-model="listQuery.search_date"


                                    @change="initData(true)"


                                    range-separator="至"


                                    start-placeholder="开始日期"


                                    end-placeholder="结束日期">


                                </el-date-picker>


                            </el-form-item>


                         </el-col>


                    </el-row>


                    <el-row :gutter="20">


                      <el-col :span="8">


                        <el-card class="box-card">


                          <h3>订单金额</h3>


                          <div>


                            <i class="el-icon-s-shop" style="color: purple"></i>


                            <span>{{tableData.total_money}}</span>


                          </div>


                        </el-card>


                      </el-col>


                      <el-col :span="8">


                        <el-card class="box-card">


                          <h3>订单数量</h3>


                          <div>


                            <i class="el-icon-user-solid" style="color: green"></i>


                            <span>{{tableData.total_order}}</span>


                          </div>


                        </el-card>


                      </el-col>


                      <el-col :span="8">


                        <el-card class="box-card">


                          <h3>访客</h3>


                          <div>


                            <i class="el-icon-s-flag" style="color: red"></i>


                            <span>{{tableData.user}}</span>


                          </div>


                        </el-card>


                      </el-col>


                    </el-row>


                    <BarHeapChart ref="BarHeapChart" :xAxisData="tableData.x_axis_data" :seriesData="tableData.series_data"/>


                    <LineHeapChart ref="LineHeapChart" :xAxisData="tableData.x_axis_data" :seriesData="tableData.series_data" />


                `


                })


            })


        })()
最后调PHP后端接口获取最新数据:
          //获取统计信息


            public function echarts()


        {


                $input_data = input();


                list($x_axis_data1, $series_data1) = LocationUserModel::echarts($input_data);


                $fnc = function($name,$data){


                    return [


                        "name"=> $name,


                        "type"=> 'line',


                        "symbolSize"=> 12,


                        "data"=> $data


                    ];


                };


                return $this->_resData(1,'获取成功',[


                    'x_axis_data'=>$x_axis_data1,


                    'series_data'=>[$fnc('订单数量',$series_data1)],


                    'total_order'=>LocationUserModel::where('state','<>',2)->count(),


                    'total_money'=>LocationUserModel::where('is_pay',1)->where('state','<>',2)->count(),


                    'user'=>UserModel::count()


                ]);


            }
LocationUserModel模型方法:
          //列表统计


            public static function echarts(array $php_input)


        {


                $date_mode = $php_input['date_mode'] ?? 'day';


                $where = [];


                $group = 'op_time';


                $field = ' count(*) as count_num ';


                if ($date_mode == 'day') { //按小时计算


                    $where[] = ['create_time', '>=', strtotime(date('Y-m-d'))];


                    $field .= ' ,FROM_UNIXTIME(create_time,\'%H\') as op_time';


                } elseif ($date_mode == 'week') {


                    $where[] = ['create_time', '>=', strtotime(date('Y-m-d')) - 7 * 84600];


                    $field .= ' ,FROM_UNIXTIME(create_time,\'%Y-%m-%d\') as op_time';


                } elseif ($date_mode == 'month') {


                    $field .= ' ,FROM_UNIXTIME(create_time,\'%Y-%m-%d\') as op_time';


                    $where[] = ['create_time', '>=', strtotime(date('Y-m-d')) - 30 * 84600];


                } elseif ($date_mode == 'month60') {


                    $field .= ' ,FROM_UNIXTIME(create_time,\'%Y-%m-%d\') as op_time';


                    $where[] = ['create_time', '>=', strtotime(date('Y-m-d')) - 60 * 84600];


                } elseif ($date_mode == 'year') {


                    $field .= ' ,FROM_UNIXTIME(create_time,\'%Y-%m-%d\') as op_time';


                    $where[] = ['create_time', '>=', strtotime(date('Y-m-d')) - 365 * 84600];


                }


                $date_list = get_op_time($date_mode);


                $list = [];


                foreach ($date_list as $vo) {


                    $list[$vo] = [


                        'name' => $vo,


                        'value' => 0


                    ];


                }


                Db::table('location_user')->field($field)->where($where)


                    ->group($group)->select()->each(function ($item) use (&$list, $date_list) {


                        $key = $item['op_time'];


                        $list[$key]['value'] = $item['count_num'];


                    });


                return [array_column($list, 'name'), array_column($list, 'value')];


          //        self::field($field)->where($where)->gourp($group)->select();


            }
评论