五分钟学会C++高效图表绘制神器调用
点击上方“小白学视觉”,选择加"星标"或“置顶”
重磅干货,第一时间送达
引言
给大家介绍一个C++上简单高效的图表绘制与数据可视化的神器 matplotlib-cpp。先交代我的系统配置跟软件版本信息
- Windows 10 64位- VS2015- Python3.6.5- OpenCV4.2
通过C++调用python的matplotlib工具包实现各种数据图表显示,是最简单的C++图表库。支持Windows跟Linux系统下使用。
下载
git clone https://github.com/lava/matplotlib-cpp.git目录结构如下:

在contrib文件夹下面打开WinBuild.cmd,运行这个脚本即可完成编译,但是在运行之前先打开修改4~8行的默认参数,符合自己的软件版本与信息,我的修改如下:
1REM ------Set Your Environment-------------------------------
2if NOT DEFINED MSVC_VERSION set MSVC_VERSION=14
3if NOT DEFINED CMAKE_CONFIG set CMAKE_CONFIG=Release
4if NOT DEFINED PYTHONHOME   set PYTHONHOME=C:/Users/Administrator/AppData/Local/Programs/Python/Python36
5REM ---------------------------------------------------------
然后在windows 命令行窗口运行如下:
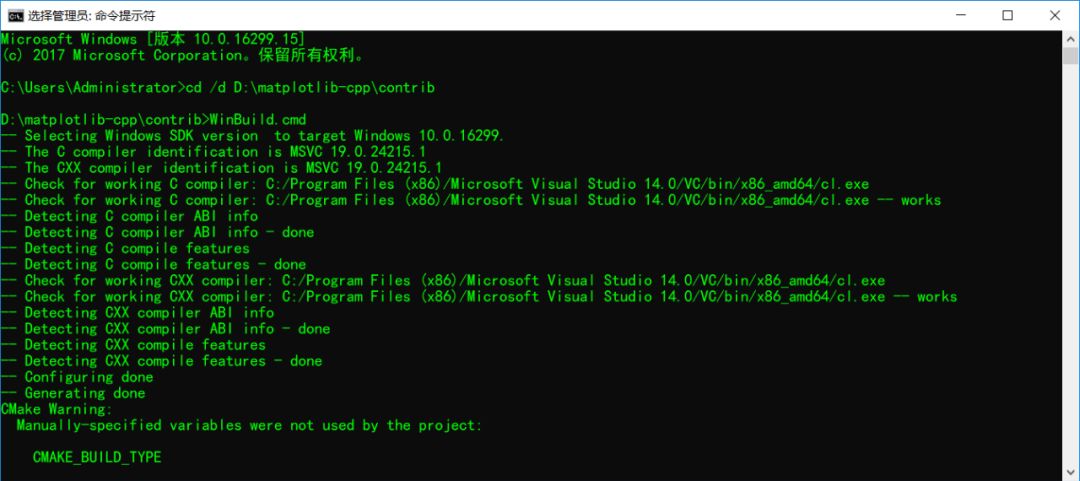
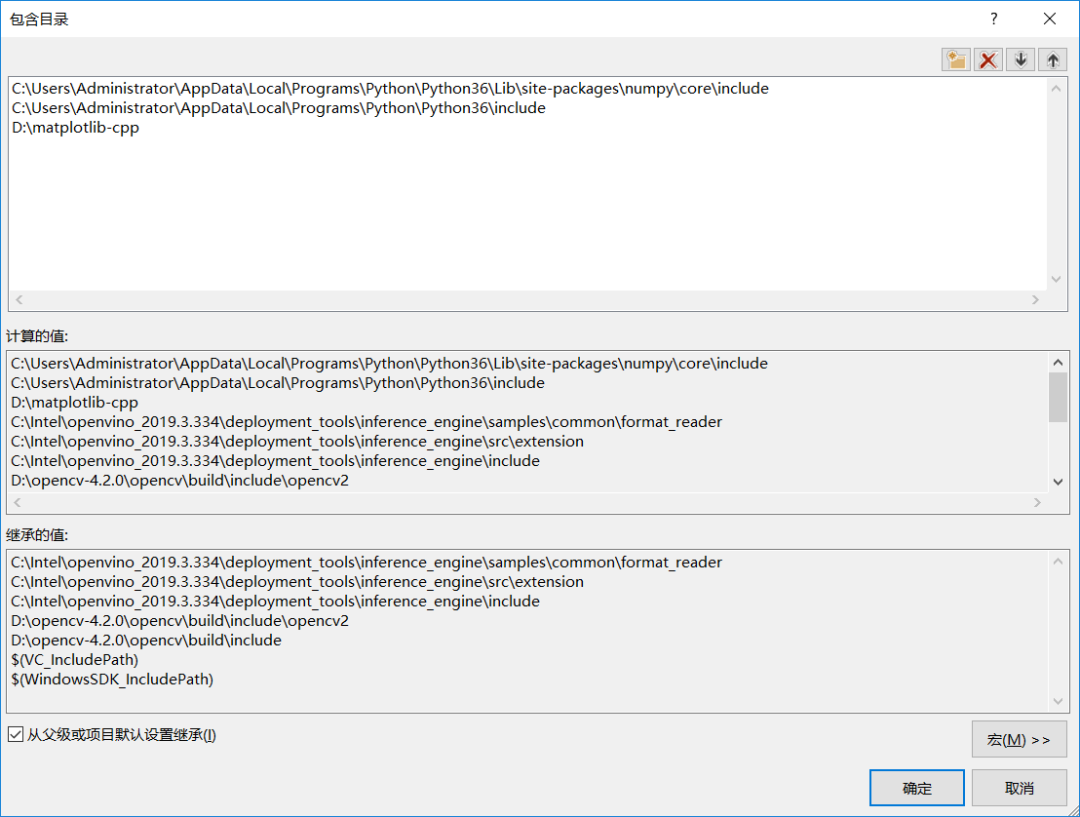
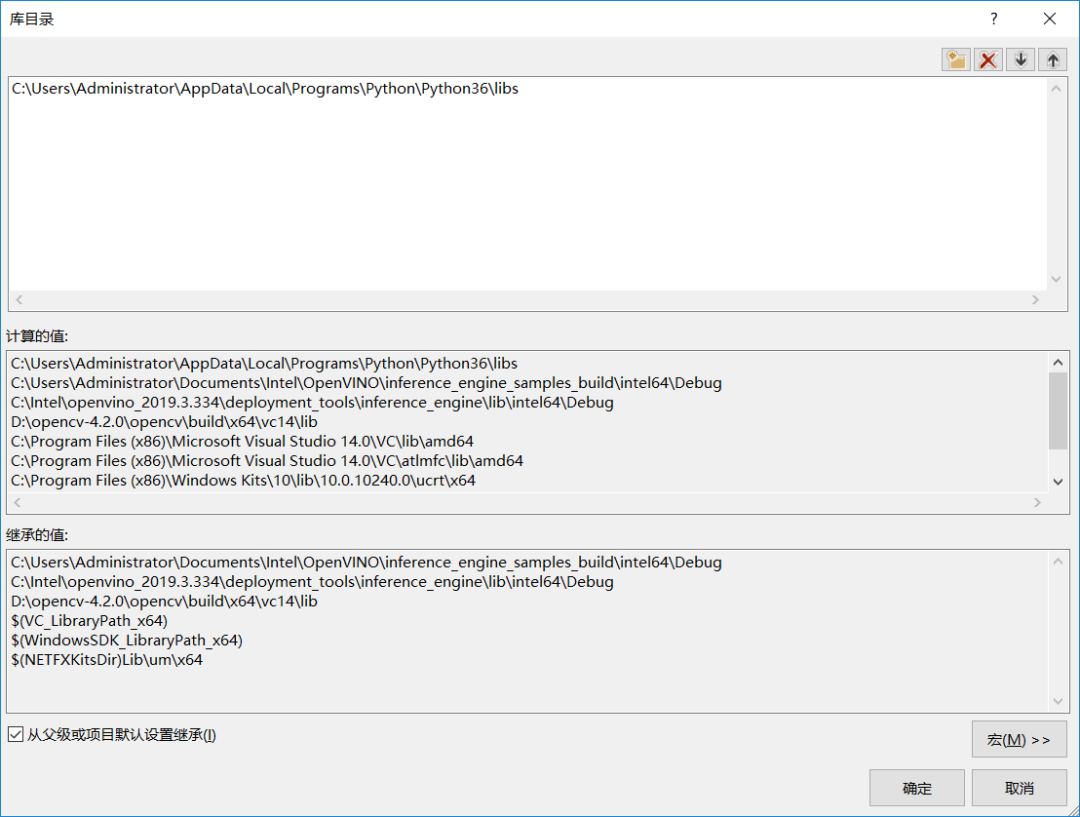
完成编译之后就好啦,现在需要完成VS2015的配置,主要分为三步:
- 配置包含路径
- 配置库目录
- 配置链接器
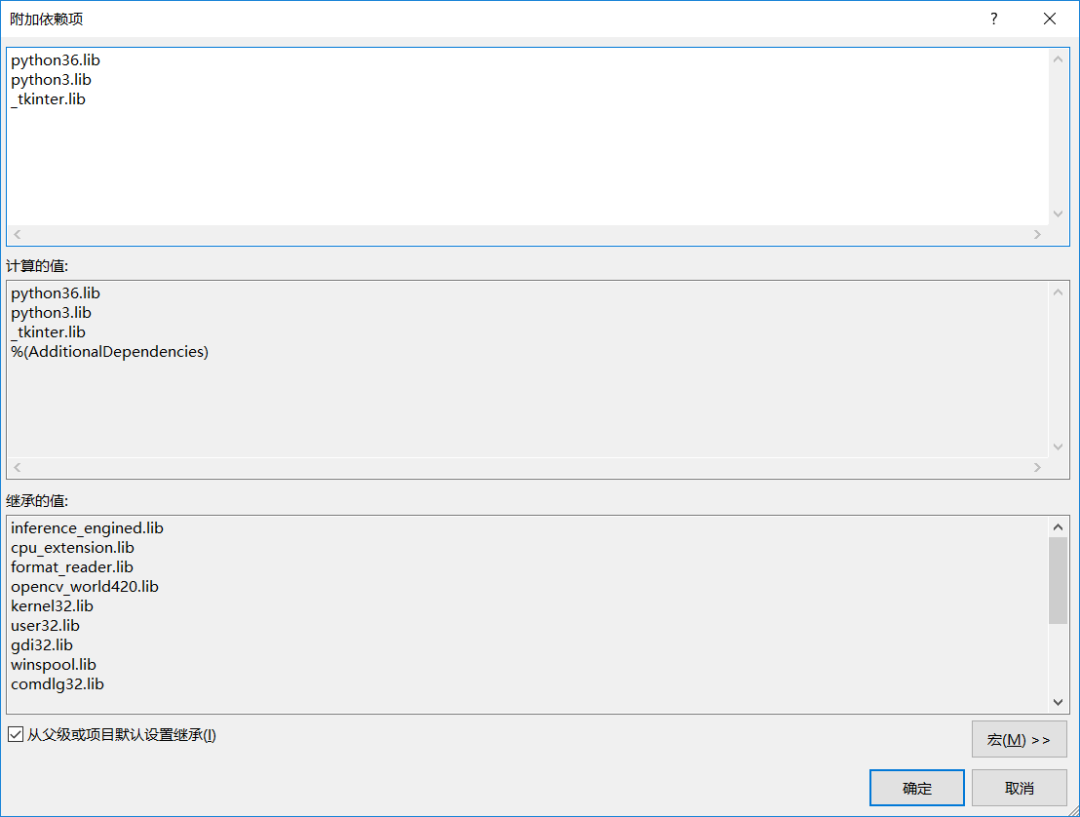
注意:
还有最重要的一点,把对应的python的home目录设置到环境变量中去!
- 测试matplotlib-cpp
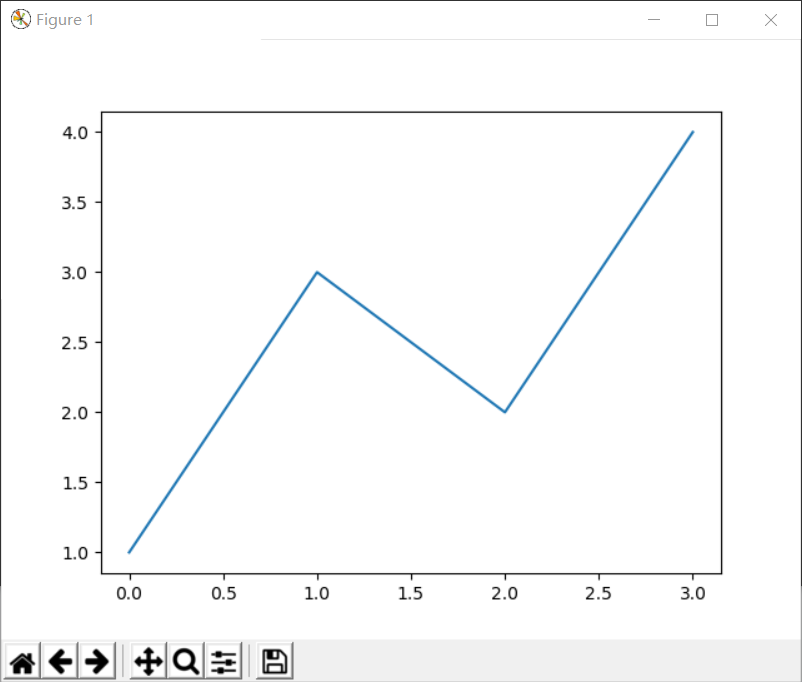
创建一个测试cpp文件,添加如下代码:
1#include "matplotlibcpp.h"
2namespace plt = matplotlibcpp;
3int main() {
4    plt::plot({1,3,2,4});
5    plt::show();
6}
运行结果如下:
OpenCV + matplotlib-cpp联合使用
显示图像
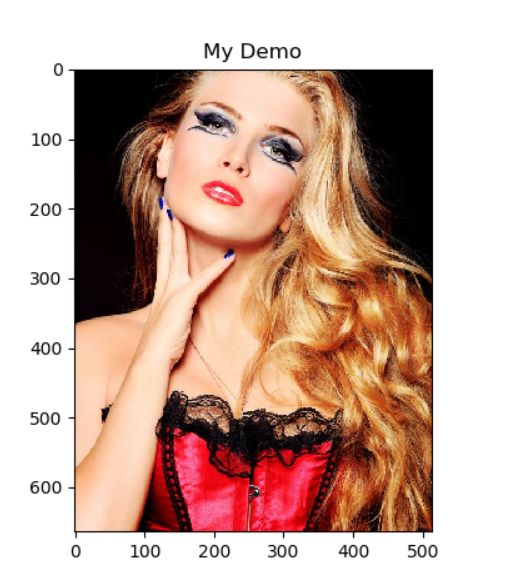
通过 plt::imshow 支持黑白跟彩色图像显示,显示一张图像的代码如下:
1Mat src = imread("D:/images/test1.png");
2cvtColor(src, src, COLOR_BGR2RGB);
3const uchar* buff = src.ptr(0);
4int h = src.rows;
5int w = src.cols;
6int channels = src.channels();
7plt::title("My Demo");
8plt::imshow(buff, h, w, channels);
9plt::show();
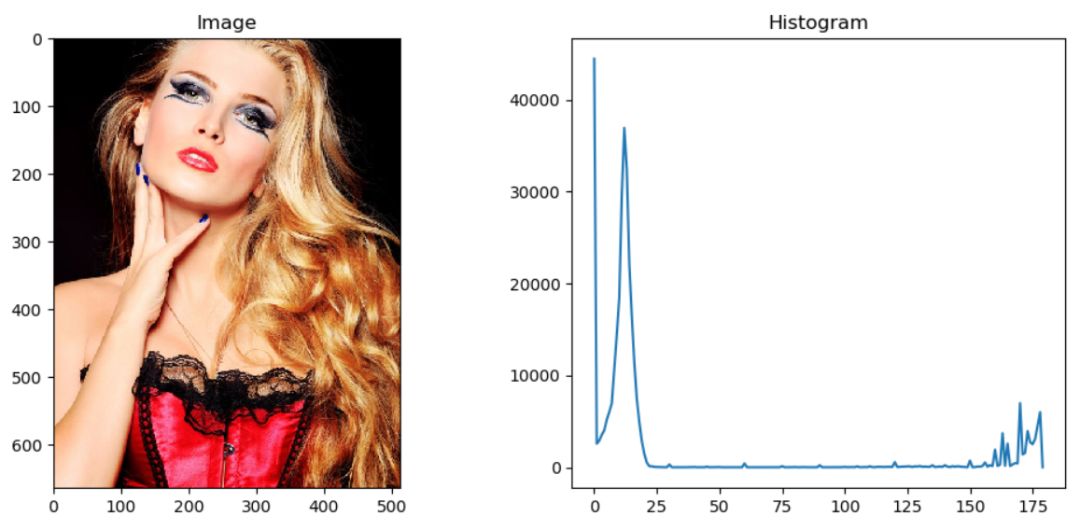
图像转为HSV色彩空间,对H通道显示对应的直方图曲线
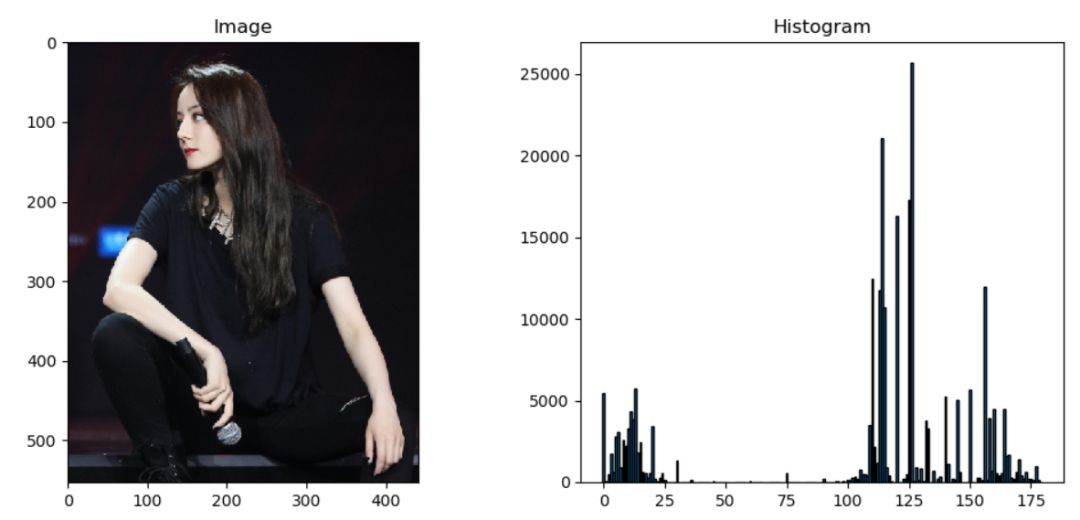
直方图Bar
从数据绘制各种图表
 1// Prepare data.
 2int n = 5000; // number of data points
 3vector<double> x(n), y(n);
 4for (int i = 0; i 5    double t = 2 * CV_PI*i / n;
 6    x.at(i) = 16 * sin(t)*sin(t)*sin(t);
 7    y.at(i) = 13 * cos(t) - 5 * cos(2 * t) - 2 * cos(3 * t) - cos(4 * t);
 8}
 9
10// plot() takes an arbitrary number of (x,y,format)-triples.
11// x must be iterable (that is, anything providing begin(x) and end(x)),
12// y must either be callable (providing operator() const) or iterable.
13plt::plot(x, y, "r-", x, [](double d) { return 12.5 + abs(sin(d)); }, "k-");
14
15
16// show plots
17plt::show();
显示如下:
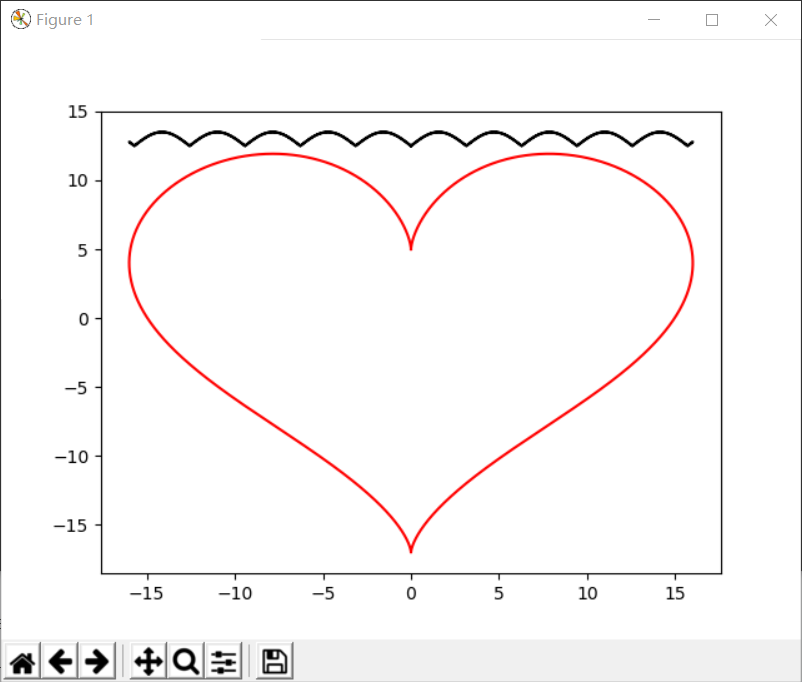
来个3D的数据可视化
 1std::vector<std::vector<double>> x, y, z;
 2for (double i = -5; i <= 5;  i += 0.25) {
 3    std::vector<double> x_row, y_row, z_row;
 4    for (double j = -5; j <= 5; j += 0.25) {
 5        x_row.push_back(i);
 6        y_row.push_back(j);
 7        z_row.push_back(::std::sin(::std::hypot(i, j)));
 8    }
 9    x.push_back(x_row);
10    y.push_back(y_row);
11    z.push_back(z_row);
12}
13
14plt::plot_surface(x, y, z);
15plt::show();
显示如下:
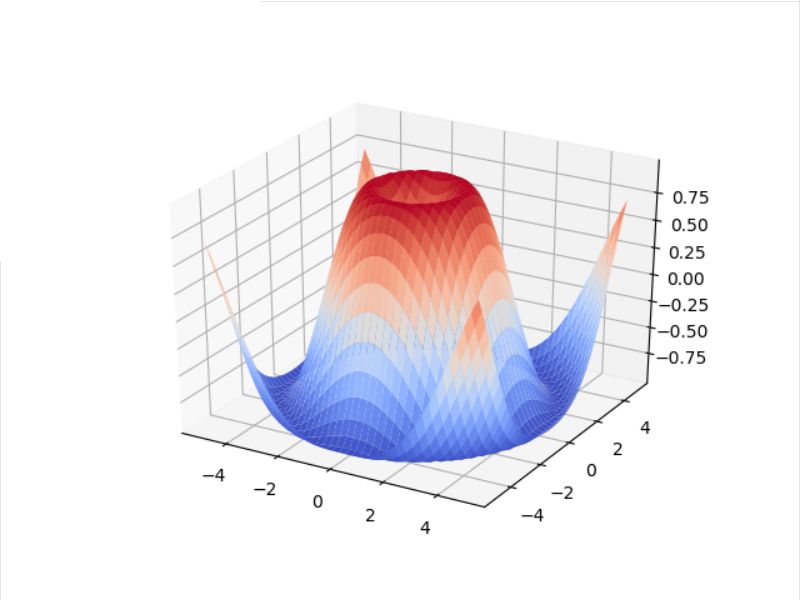
好消息,小白学视觉团队的知识星球开通啦,为了感谢大家的支持与厚爱,团队决定将价值149元的知识星球现时免费加入。各位小伙伴们要抓住机会哦!

交流群
欢迎加入公众号读者群一起和同行交流,目前有SLAM、三维视觉、传感器、自动驾驶、计算摄影、检测、分割、识别、医学影像、GAN、算法竞赛等微信群(以后会逐渐细分),请扫描下面微信号加群,备注:”昵称+学校/公司+研究方向“,例如:”张三 + 上海交大 + 视觉SLAM“。请按照格式备注,否则不予通过。添加成功后会根据研究方向邀请进入相关微信群。请勿在群内发送广告,否则会请出群,谢谢理解~

