
降本增效!5款超有用的开源 Python 工具包!
大家好,我是老表~
无论我们是用数据进行业务分析还是构建机器学习模型,糟糕的数据都会浪费我们大量的时间。疫情无法外出,在家逛了一下 Github,发现了几款不错的工具。
今天我就来分享5个有用的开源 Python 工具包,它们可有效提升日常工作效率。喜欢记得收藏、点赞、关注。
1、Pandas Profiling
 从 Pandas Dataframes 生成数据分析报告的库。我们知道 df.describe() 函数很棒,但对于专业的探索性数据分析来说有点基础,pandas_profiling 使用 df.profile_report() 扩展了 pandas DataFrame 以进行快速数据分析。
Github链接:https://github.com/ydataai/pandas-profiling
主要特征:
数据分析(缺失值和唯一值,, ..) 数据分布和直方图 分位数和描述性统计(平均值、标准偏差、Q1、...) 类型推断 相互作用和相关性 创建 Html 格式报告
实战案例
import numpy as np
import pandas as pd
from pandas_profiling import ProfileReport
df = pd.DataFrame(np.random.rand(100, 5), columns=["a", "b", "c", "d", "e"])
profile = ProfileReport(df, title="Pandas Profiling Report")
2、ydata_quality
ydata_quality 是一个开源 python 库,用于在数据开发的多个阶段评估数据质量。
这个库的好处在于它可以提供基于数据质量问题的排序,这是很有帮助的,我们也想优先处理对我们数据质量影响较大的问题。
Github链接:https://github.com/ydataai/ydata-quality
只需几行代码的全面质量检查
from ydata_quality import DataQuality
import pandas as pd

#Load in the data
df = pd.read_csv('./datasets/transformed/census_10k.csv')

# create a DataQuality object from the main class that holds all quality modules
dq = DataQuality(df=df)

# run the tests and outputs a summary of the quality tests
results = dq.evaluate()
3、Alibi Detect
Alibi Detect 是一个专注于异常值、对抗性和漂移检测的机器学习专用库。
Github链接:https://github.com/SeldonIO/alibi-detect
主要特征:
表格数据、文本、图像和时间序列的漂移和异常值检测 涵盖在线和离线检测器 TensorFlow 和 PyTorch 后端支持漂移检测。
异常检测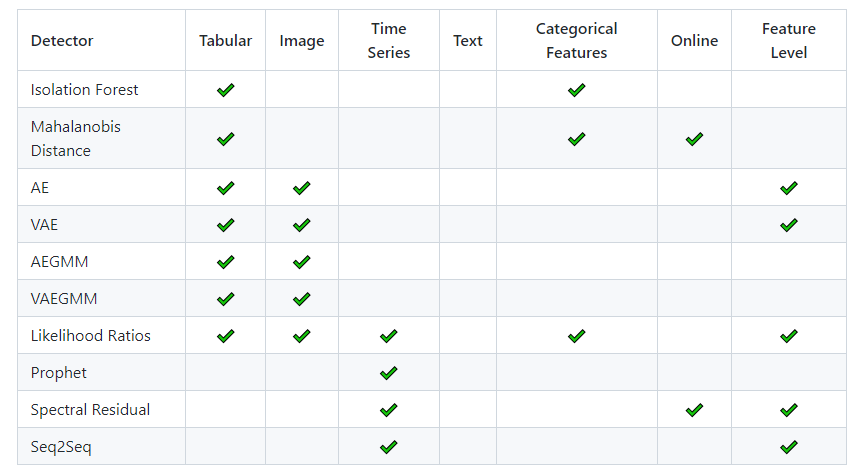 对抗性检测
对抗性检测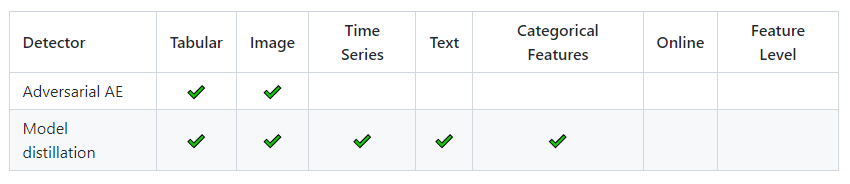 漂移检测
漂移检测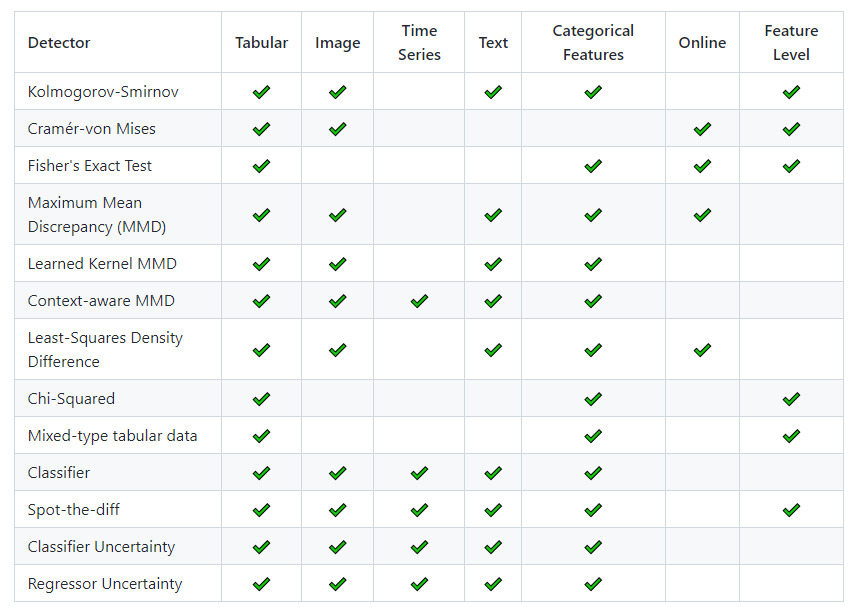
使用案例
from alibi_detect.od import OutlierVAE
from alibi_detect.utils import save_detector, load_detector

# initialize and fit detector
od = OutlierVAE(threshold=0.1, encoder_net=encoder_net, decoder_net=decoder_net, latent_dim=1024)
od.fit(x_train)

# make predictions
preds = od.predict(x_test)

# save and load detectors
filepath = './my_detector/'
save_detector(od, filepath)
od = load_detector(filepath)
4、Dora
Dora 是一个 Python 库,旨在自动化探索性数据分析的痛苦部分。该库包含用于数据清理、特征选择和提取、可视化、模型验证的数据分区和数据版本转换的便利功能。
该库旨在成为常见 Python 数据分析工具(如 pandas、scikit-learn 和 matplotlib)的有用补充。
主要特征:
数据清理(空值、类别到序数、删除列、列转换) 特征选择和提取 可视化(绘图功能) 为模型验证划分数据 数据的版本转换
使用案例
# read data with missing and poorly scaled values
>>> import pandas as pd
>>> df = pd.DataFrame([
...   [1, 2, 100],
...   [2, None, 200],
...   [1, 6, None]
... ])
>>> dora = Dora(output = 0, data = df)
>>> dora.data
   0   1    2
0  1   2  100
1  2 NaN  200
2  1   6  NaN

# impute the missing values (using the average of each column)
>>> dora.impute_missing_values()
>>> dora.data
   0  1    2
0  1  2  100
1  2  4  200
2  1  6  150

# scale the values of the input variables (center to mean and scale to unit variance)
>>> dora.scale_input_values()
>>> dora.data
   0         1         2
0  1 -1.224745 -1.224745
1  2  0.000000  1.224745
2  1  1.224745  0.000000
5、Pretty Pandas
PrettyPandas 是一个 Pandas DataFrame Styler 类,可帮助你使用简单的 API 创建报告质量表。
通过以下方式使表格更具可读性:
添加汇总行和列 货币和百分比的数字格式 造型背景渐变
案例
   df.pipe(PrettyPandas)
   .as_currency('GBP', subset='A')
   .as_percent(subset='B')
   .total()
   .average()
--end-- 扫码即可加我微信
学习交流
老表朋友圈经常有赠书/红包福利活动