
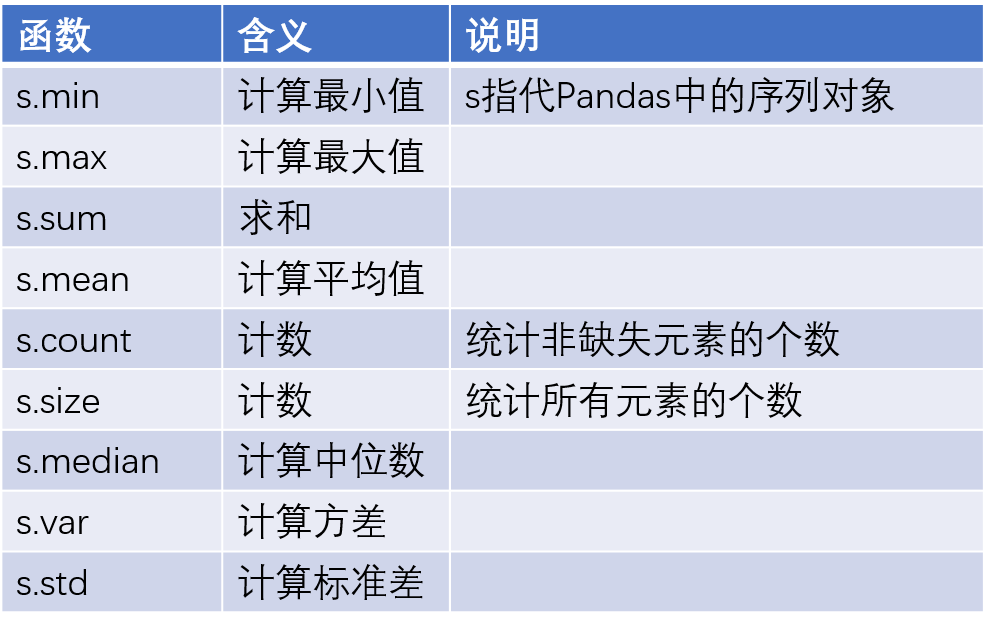
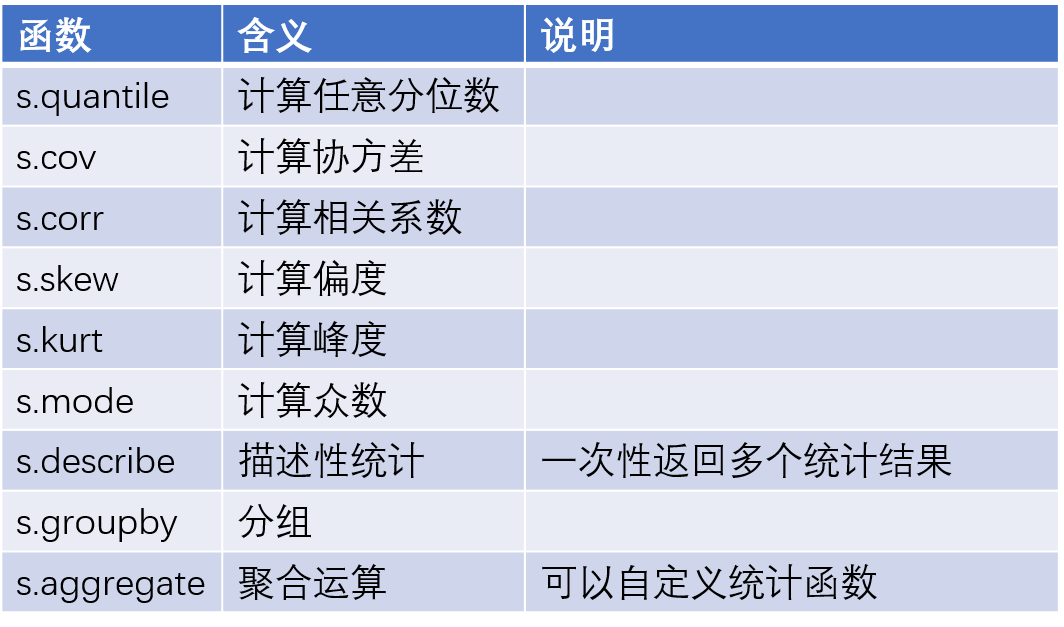
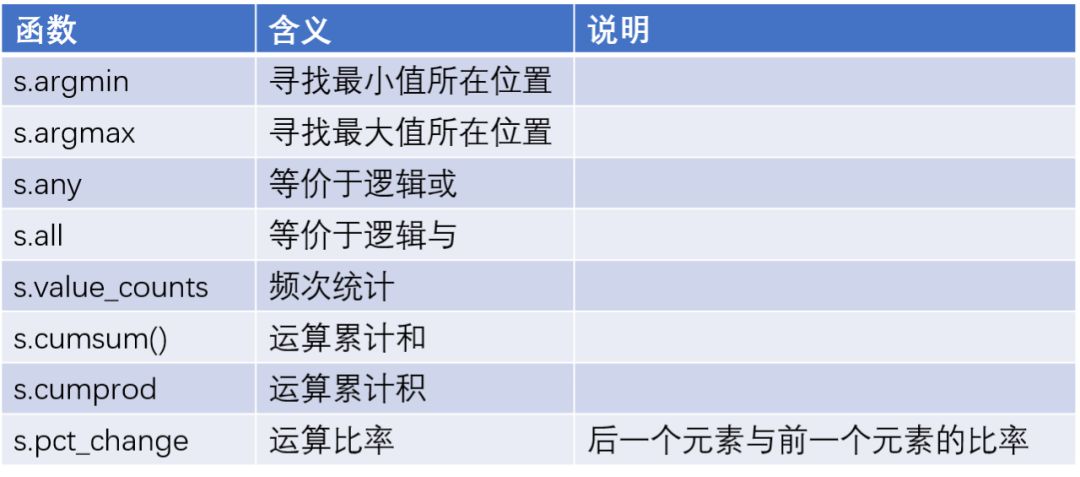
100 个 pandas 数据分析函数总结
(点击上方快速关注并设置为星标,一起学Python)
来源:数据分析1480

import pandas as pd
import numpy as np
x = pd.Series(np.random.normal(2,3,1000))
y = 3*x + 10 + pd.Series(np.random.normal(1,2,1000))
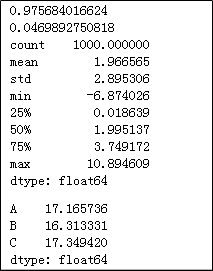
# 计算x与y的相关系数
print(x.corr(y))
# 计算y的偏度
print(y.skew())
# 计算y的统计描述值
print(x.describe())
z = pd.Series(['A','B','C']).sample(n = 1000, replace = True)
# 重新修改z的行索引
z.index = range(1000)
# 按照z分组,统计y的组内平均值
y.groupby(by = z).aggregate(np.mean)
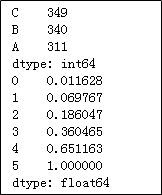
# 统计z中个元素的频次
print(z.value_counts())

a = pd.Series([1,5,10,15,25,30])
# 计算a中各元素的累计百分比
print(a.cumsum() / a.cumsum()[a.size - 1])
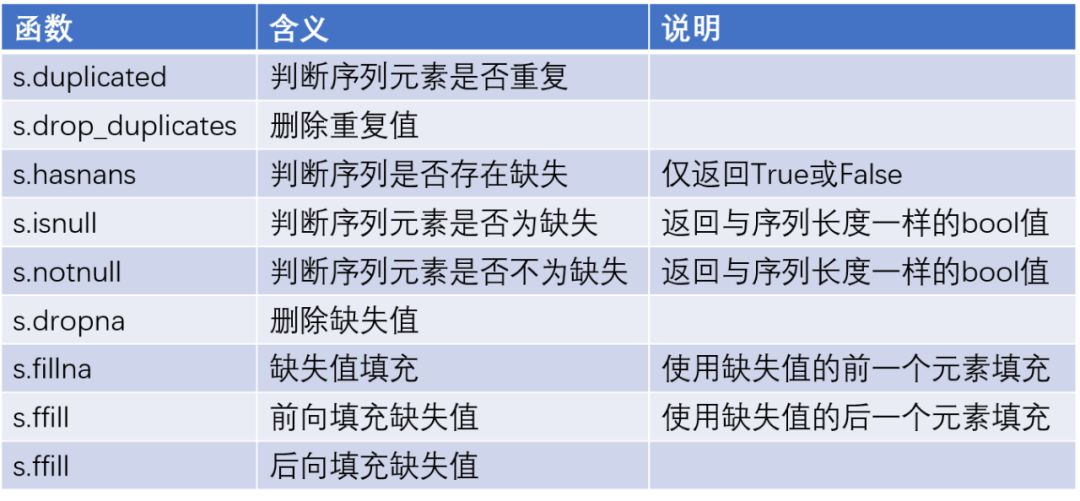
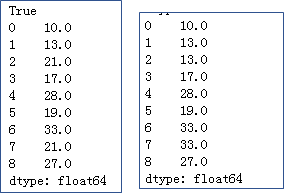
x = pd.Series([10,13,np.nan,17,28,19,33,np.nan,27])
#检验序列中是否存在缺失值
print(x.hasnans)

# 将缺失值填充为平均值
print(x.fillna(value = x.mean()))

# 前向填充缺失值
print(x.ffill())
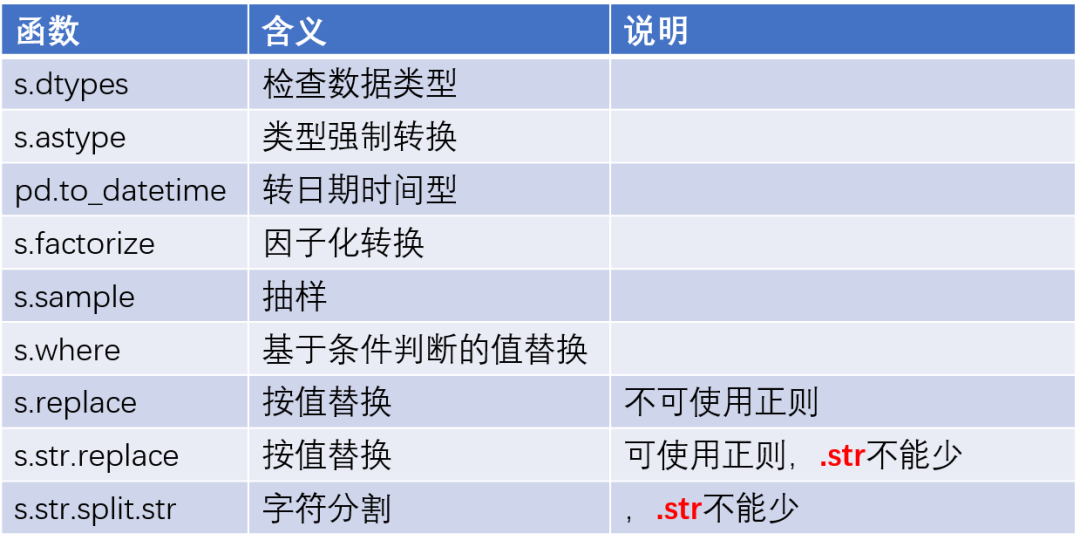
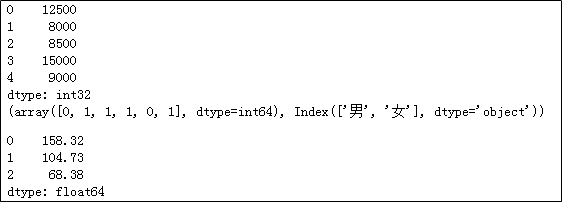
income = pd.Series(['12500元','8000元','8500元','15000元','9000元'])
# 将收入转换为整型
print(income.str[:-1].astype(int))

gender = pd.Series(['男','女','女','女','男','女'])
# 性别因子化处理
print(gender.factorize())

house = pd.Series(['大宁金茂府 | 3室2厅 | 158.32平米 | 南 | 精装',
                   '昌里花园 | 2室2厅 | 104.73平米 | 南 | 精装',
                   '纺大小区 | 3室1厅 | 68.38平米 | 南 | 简装'])
# 取出二手房的面积,并转换为浮点型
house.str.split('|').str[2].str.strip().str[:-2].astype(float)
np.random.seed(1234)
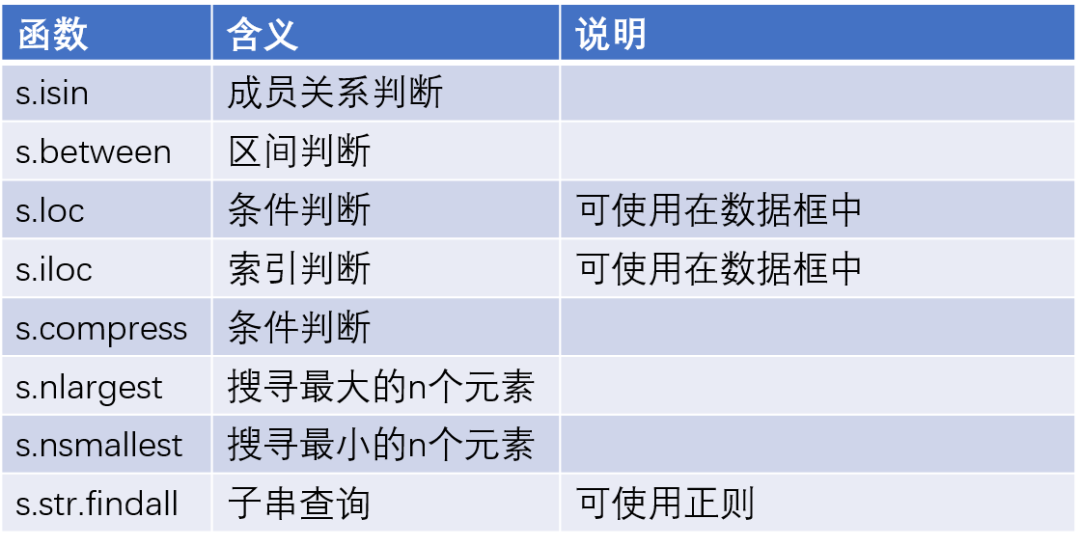
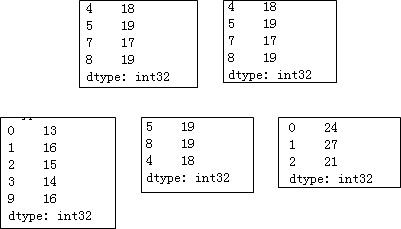
x = pd.Series(np.random.randint(10,20,10))
# 筛选出16以上的元素
print(x.loc[x > 16])
print(x.compress(x > 16))
# 筛选出13~16之间的元素
print(x[x.between(13,16)])
# 取出最大的三个元素
print(x.nlargest(3))
y = pd.Series(['ID:1 name:张三 age:24 income:13500',
'ID:2 name:李四 age:27 income:25000',
'ID:3 name:王二 age:21 income:8000'])
# 取出年龄,并转换为整数
print(y.str.findall('age:(\d+)').str[0].astype(int))
np.random.seed(123)
import matplotlib.pyplot as plt
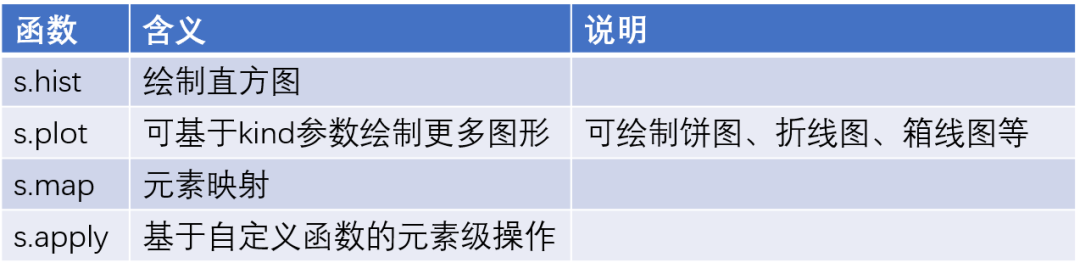
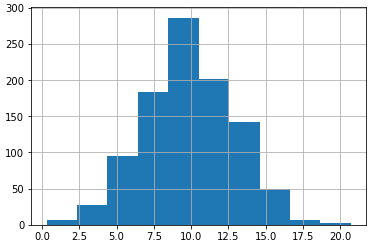
x = pd.Series(np.random.normal(10,3,1000))
# 绘制x直方图
x.hist()
# 显示图形
plt.show()
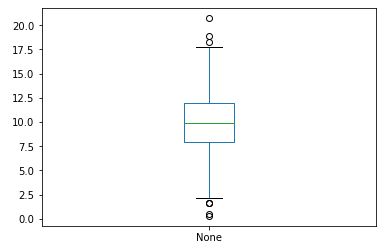
# 绘制x的箱线图
x.plot(kind='box')
plt.show()
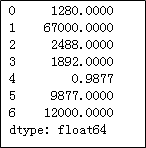
installs = pd.Series(['1280万','6.7亿','2488万','1892万','9877','9877万','1.2亿'])
# 将安装量统一更改为“万”的单位
def transform(x):
if x.find('亿') != -1:
res = float(x[:-1])*10000
elif x.find('万') != -1:
res = float(x[:-1])
else:
res = float(x)/10000
return res
installs.apply(transform)
import numpy as np
import pandas as pd
np.random.seed(112)
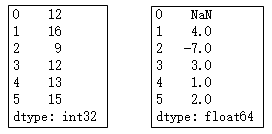
x = pd.Series(np.random.randint(8,18,6))
print(x)
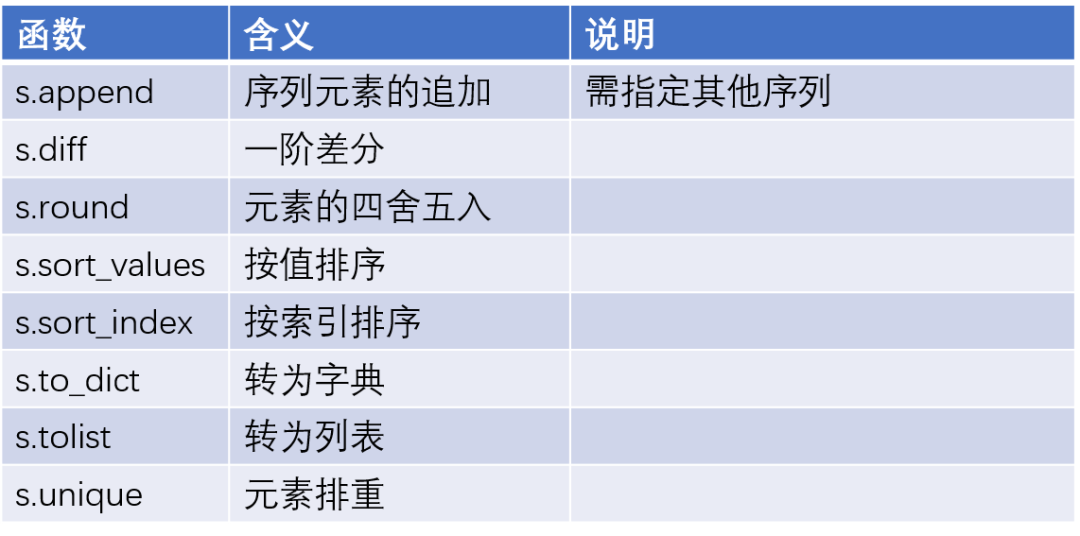
# 对x中的元素做一阶差分
print(x.diff())
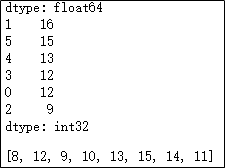
# 对x中的元素做降序处理
print(x.sort_values(ascending = False))
y = pd.Series(np.random.randint(8,16,100))
# 将y中的元素做排重处理,并转换为列表对象
y.unique().tolist()
推荐阅读:
入门: 最全的零基础学Python的问题 | 零基础学了8个月的Python | 实战项目 |学Python就是这条捷径
干货:爬取豆瓣短评,电影《后来的我们》 | 38年NBA最佳球员分析 | 从万众期待到口碑扑街!唐探3令人失望 | 笑看新倚天屠龙记 | 灯谜答题王 |用Python做个海量小姐姐素描图 |
趣味:弹球游戏 | 九宫格 | 漂亮的花 | 两百行Python《天天酷跑》游戏!
AI: 会做诗的机器人 | 给图片上色 | 预测收入 | 碟中谍这么火,我用机器学习做个迷你推荐系统电影
年度爆款文案
点这里,直达菜鸟学PythonB站!!

评论