
【中间件】.net Core中使用HttpReports进行接口统计,分析, 可视化, 监控,追踪等
HttpReports 基于.Net Core 开发的APM监控系统,使用MIT开源协议,主要功能包括,统计, 分析, 可视化, 监控,追踪等,适合在微服务环境中使用。
官方地址:https://www.yuque.com/httpreports/docs/uyaiil
主要功能
接口调用指标分析
多服务节点数据聚合分析
慢请求,错误请求分析
接口调用日志查询
多类型预警监控
HTTP,Grpc 调用分析
分布式追踪
多数据库支持,集成方便
程序性能监控
第一步打开VS新建.net项目我这里用的是.net core webapi 进行演示
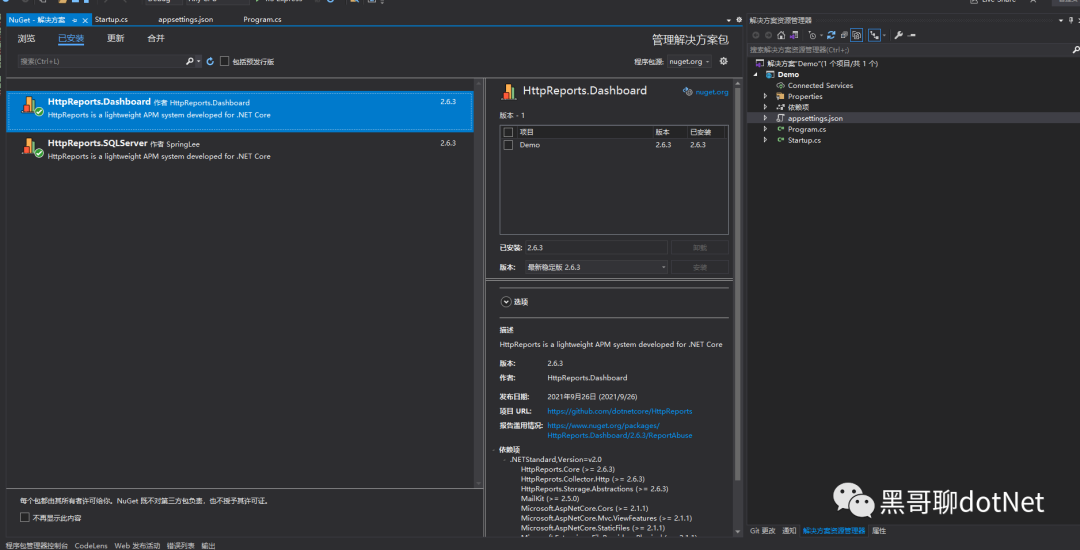
第二步 使用Nuget安装MHttpReports.Dashboard包和HttpReports.SqlServer
第三步配置appsetting.json
{"HttpReportsDashboard": {"ExpireDay": 3,"Storage": {"ConnectionString": "Server=10.1.30.252;Database=GEISDB;user id=sa;password=Mg2021;","DeferSecond": 10,"DeferThreshold": 100},"Check": {"Mode": "Self","Switch": true,"Endpoint": "","Range": "500,2000"},"Mail": {"Server": "smtp.163.com","Port": 465,"Account": "HttpReports@qq.com","Password": "*******","EnableSsL": true,"Switch": true}}}
参数介绍:
ExpireDay - 数据过期天数,默认3天,HttpReports 会自动清除过期的数据
Storage - 存储信息
DeferSecond - 批量数据入库的秒数,建议值 5-60
DeferThreshold - 批量数据入库的数量,建议值100-1000
Mail - 邮箱信息,配置监控的话,可以发告警邮件
Check - 健康检查配置,具体看 健康检查 页面
第四步配置Startup
// For more information on how to configure your application, visit https://go.microsoft.com/fwlink/?LinkID=398940public void ConfigureServices(IServiceCollection services){services.AddHttpReportsDashboard().AddSQLServerStorage();}// This method gets called by the runtime. Use this method to configure the HTTP request pipeline.public void Configure(IApplicationBuilder app, IWebHostEnvironment env){app.UseHttpReportsDashboard();}
把Dashboard 程序启动起来,如果没有问题的话,会跳转到Dashboard的登陆页面
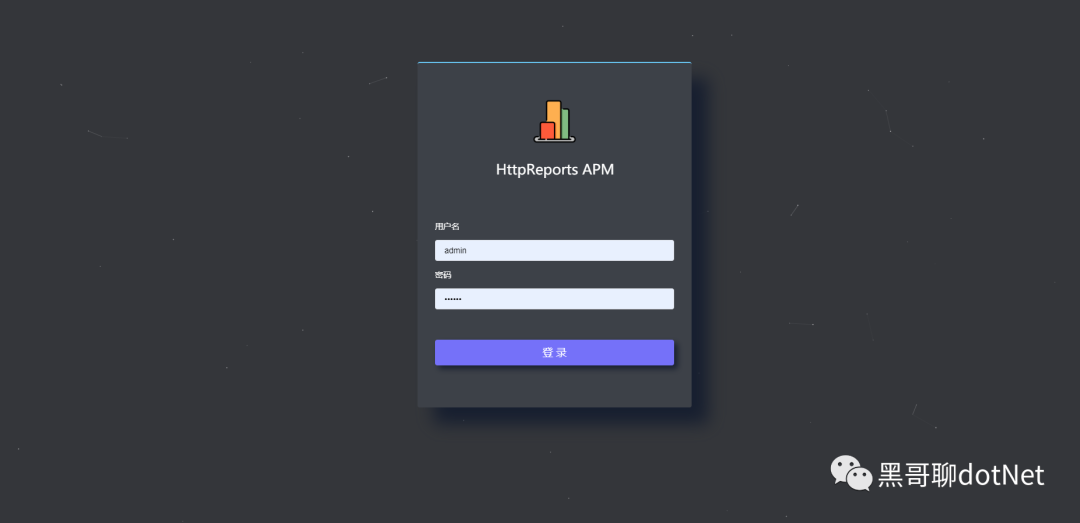
默认账号:
admin 密码: 123456
现在Dashboard 可视化有了,但是没有数据,我们还需要 给服务端程序,添加 HttpReports 来收集信息。
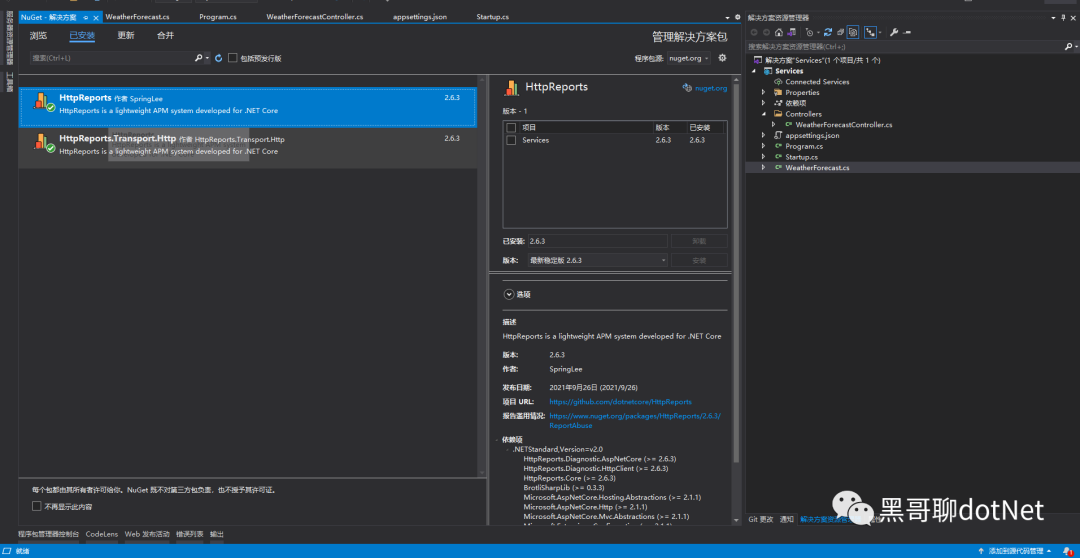
第五步 我新建一个WebAPI 项目 UserService ,来充当用户服务,然后安装 HttpReports,HttpReports.Transport.Http
第六步修改Services的Appsettings.json 简单配置一下
{"HttpReports": {"Transport": {"CollectorAddress": "http://localhost:5000/","DeferSecond": 10,"DeferThreshold": 100},"Server": "http://localhost:7000","Service": "User","Switch": true,"RequestFilter": [ "/api/health/*", "/HttpReports*" ],"WithRequest": true,"WithResponse": true,"WithCookie": true,"WithHeader": true}}
参数介绍:
Transport -
CollectorAddress - 数据发送的地址,配置Dashboard 的项目地址即可
DeferSecond - 批量数据入库的秒数,建议值 5-60
DeferThreshold - 批量数据入库的数量,建议值100-300
Server - 服务的地址,
Service - 服务的名称
Switch - 是否开启收集数据
RequestFilter - 数据过滤,用 * 来模糊匹配
WithRequest - 是否记录接口的入参
WithResponse - 是否记录接口的出参
WithCookie - 是否记录Cookie 信息
WithHeader - 是否记录请求Header信息
最后一步我们接着修改 UserService 项目的 Startup.cs 文件
app.UseHttpReports(); 这一行最好放到 Configure 方法 最上面
public void ConfigureServices(IServiceCollection services){services.AddHttpReports().AddHttpTransport();services.AddControllers();}
// This method gets called by the runtime. Use this method to configure the HTTP request pipeline.public void Configure(IApplicationBuilder app, IWebHostEnvironment env){app.UseHttpReports();if (env.IsDevelopment()){app.UseDeveloperExceptionPage();}app.UseRouting();app.UseAuthorization();app.UseEndpoints(endpoints =>{endpoints.MapControllers();});}
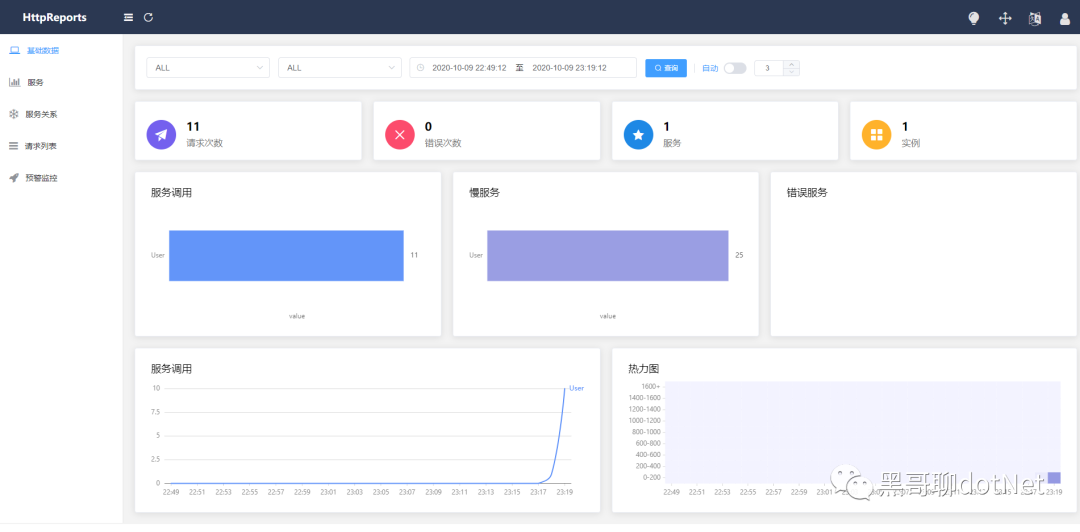
刷新下 UserService 的接口,再回到Dashboard的页面上面,已经可以看到数据了
总结
本篇博客描述了使用HttpReports进行接口统计,分析, 可视化, 监控,追踪等
如果觉得还不错,请给个关注