
开发必知必会的几套方案
eflk
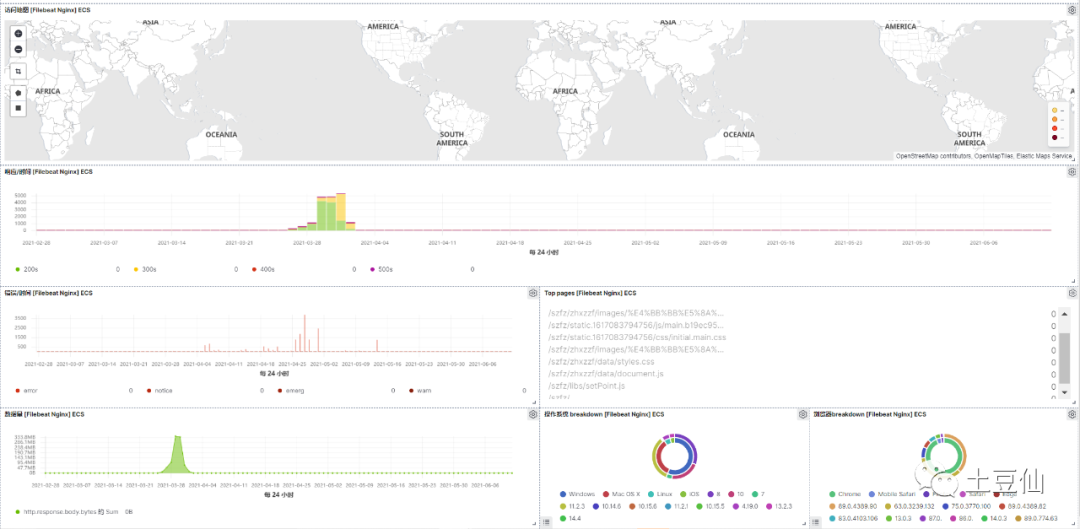
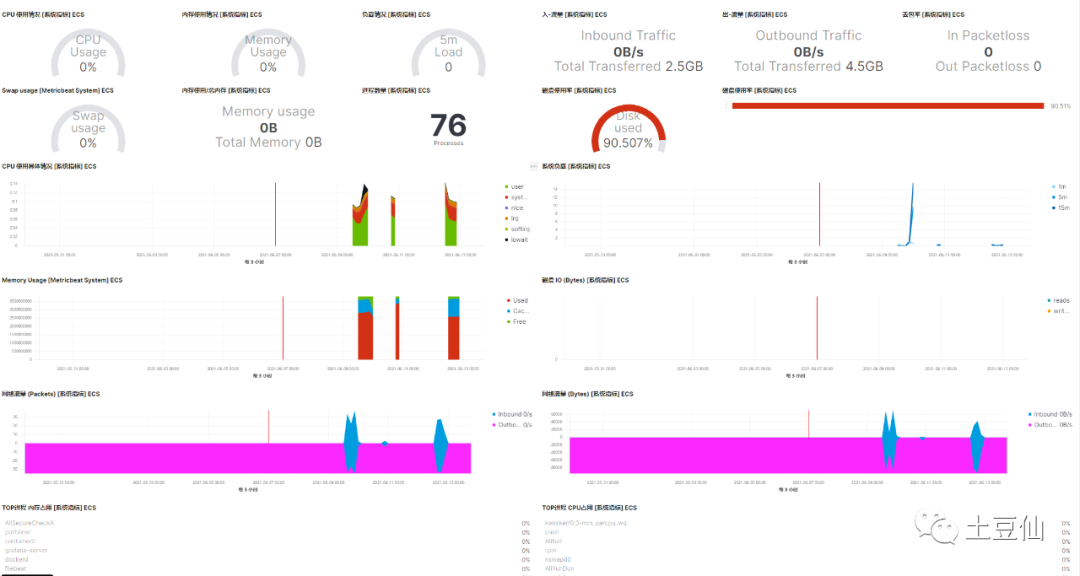
elasticsearch+filebeat、metricbeat+logstash+kibana
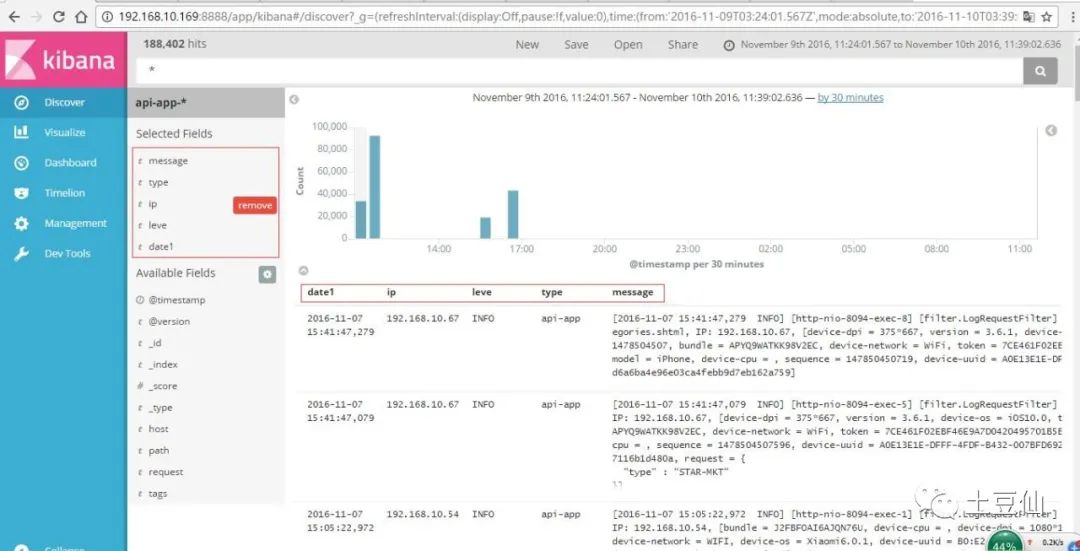
用于日志查询
Elasticsearch是一个基于Lucene的搜索服务器。提供一个分布式多用户能力的全文搜索引擎。
Kibana是开源的分析与可视化平台,能够让您对 Elasticsearch 数据进行可视化。
Logstash是一个开源数据收集引擎,具有实时管道功能。Logstash可以动态地将来自不同数据源的数据统一起来,并将数据标准化到你所选择的目的地。(相当于专一而不是通用化的ELT工具)
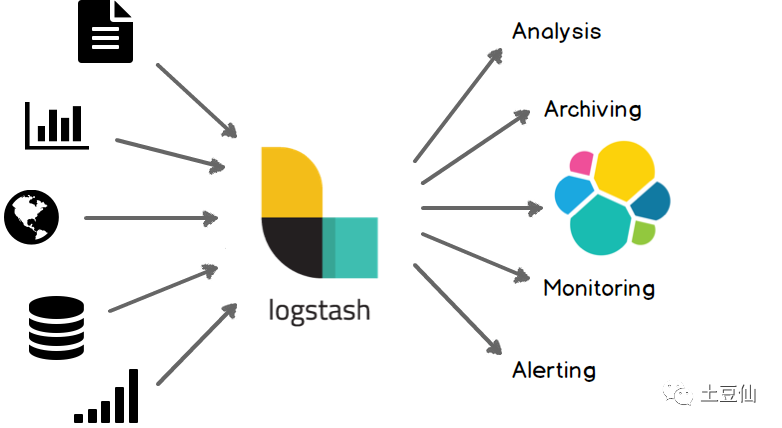
Beats在是一个轻量级日志采集器,相比Logstash,Beats所占系统的CPU和内存几乎可以忽略不计。目前Beats含六种工具:Packetbeat:网络数据(收集网络流量数据)、Metricbeat:指标(收集系统、进程和文件系统级别的CPU和内存使用情况等数据)、Filebeat:日志文件(收集文件数据)、Winlogbeat:windows事件日志(收集Windows事件日志数据)、Auditbeat:审计数据(收集审计日志)、Heartbeat:运行时间监控(收集系统运行时的数据)。
(Logstash是JVM语言,Filebeat是Go语言写的,这也能说明一点在语言层面的选择性吧),这里用到Filebeat、Metricbeat。
1. 程序日志
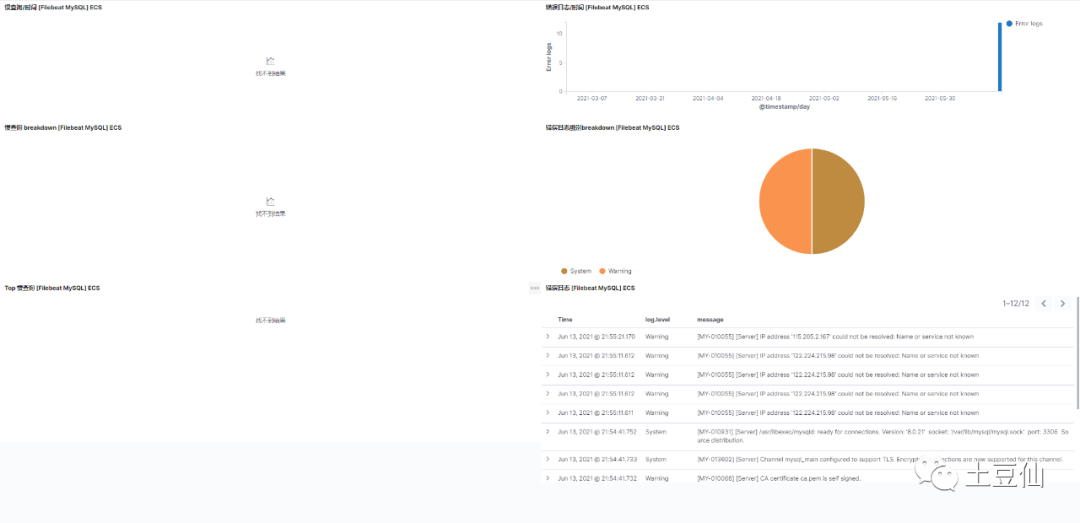
2. mysql慢查询日志
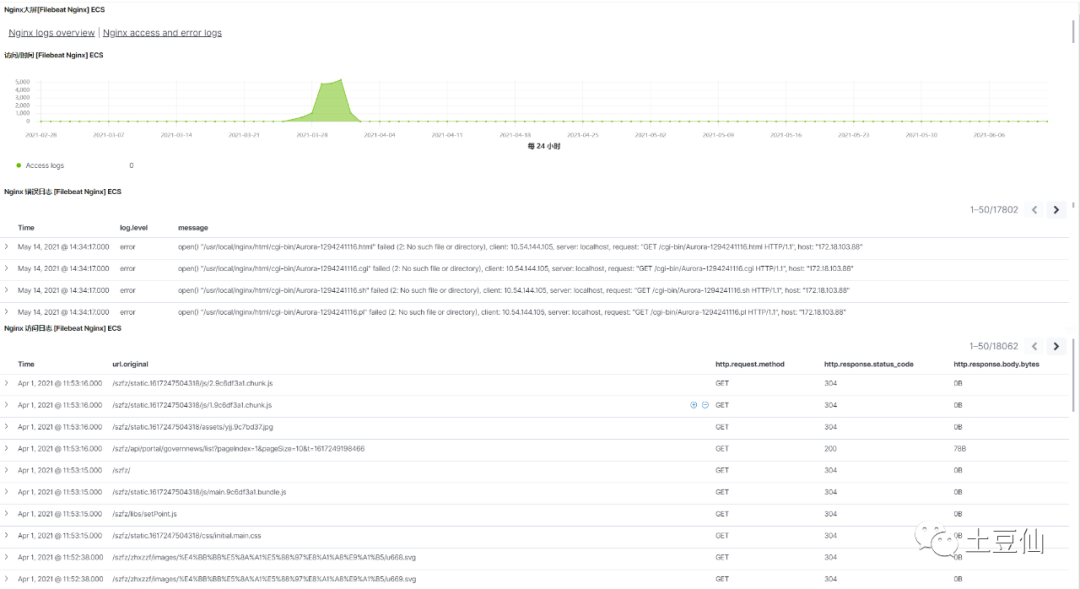
3. Nginx日志
4. 系统指标监控
安装Elasticsearch+Kibana+密码配置:
镜像docker pull docker.elastic.co/elasticsearch/elasticsearch:7.10.0启动docker run --name localEs -d -p 9200:9200 -p 9300:9300 -e "discovery.type=single-node" docker.elastic.co/elasticsearch/elasticsearch:7.10.0配置docker exec -it localEs bashcd configvi elasticsearch.yml//配置http.cors.enabled: truehttp.cors.allow-origin: "*"http.cors.allow-headers: Authorizationxpack.security.enabled: truexpack.security.transport.ssl.enabled: true//配置密码-重启容器elasticsearch-setup-passwords interactive//安装kibinadocker pull docker.elastic.co/kibana/kibana:7.10.0docker run --name kibana -d --link localEs:elasticsearch -p 5601:5601 docker.elastic.co/kibana/kibana:7.10.0//配置docker exec -it kibana bashcd configvi kibana.yml//配置server.name: kibanaserver.host: "0.0.0.0"elasticsearch.hosts: [ "http://{IpAddress}:9200" ]//docker inspect es查看es容器内部的ip地址monitoring.ui.container.elasticsearch.enabled: trueelasticsearch.username: "elastic"elasticsearch.password: "zmx111222"i18n.locale: "zh-CN"重启容器
安装Logstash
1.下载 https://www.elastic.co/downloads/logstashhttps://artifacts.elastic.co/downloads/logstash/logstash-7.13.1-linux-x86_64.tar.gz2.配置编辑 /opt/logstash/logstash-7.13.1/config/logstash.yml配置文件修改如下内容:node.name: aliyun2corepath.data: /opt/logstash/plugin-dataconfig.reload.automatic: trueconfig.reload.interval: 10http.host: "47.96.74.110"3.可以直接读取日志、也可以从插件读取-例如Filebeat、Jdbc(logstash 有非常多插件https://www.elastic.co/guide/en/logstash/current/index.html3.1安装logstash-input-jdbc 和logstash-input-beats-master 插件(暂缓测试)./bin/logstash-plugin install logstash-input-jdbc./logstash-plugin install logstash-input-beats3.2 codec插件 codec解决日志换行的问题在logstash读入的时候,通过codec编码解析日志为相应格式,从logstash输出的时候,通过codec解码成相应格式。3.3 grok插件 支持以正则表达式的方式提取日志信息用于将非结构化数据解析为结构化和可查询的数据。https://www.elastic.co/guide/en/logstash/current/plugins-filters-grok.html4.启动nohup ./logstash -f ../config/logstash.conf &
安装filebeat
1.下载https://www.elastic.co/cn/downloads/beats/filebeatcurl -L -O https://artifacts.elastic.co/downloads/beats/filebeat/filebeat-7.13.1-linux-x86_64.tar.gztar xzvf filebeat-7.13.1-linux-x86_64.tar.gzcd filebeat-7.13.1-linux-x86_642.编辑配置修改 filebeat.yml 以设置连接信息:output.elasticsearch:hosts: ["<es_url>"]username: "elastic"password: "<password>"setup.kibana:host: "<kibana_url>"monitoring.enabled: true #开启服务监控-需要 Elasticsearch 配合开启xpack monitoring=》编辑输入log日志路径:/opt/nifi/nifi-1.13.2/logs/nifi-app.log3.启用和配置 apache 模块./filebeat modules enable apache在 modules.d/apache.yml 文件中修改设置。4.启动 Filebeat./filebeat setup./filebeat -enohup ./filebeat -e -c filebeat.yml -d "publish" & > nohup.out提示:1.fileBeat可以从日志流直接获取日志信息 2.可以输出到logstash中
安装 metricbeat
下载:https://artifacts.elastic.co/downloads/beats/metricbeat/metricbeat-7.13.1-linux-x86_64.tar.gz配置:修改 /etc/metricbeat/metricbeat.yml 以设置连接信息:output.elasticsearch:hosts: ["<es_url>"]username: "elastic"password: "<password>"setup.kibana:host: "<kibana_url>"启用和配置 system 模块(其他模板差不多流程)sudo ./metricbeat modules enable system配置系统服务在 /etc/metricbeat/modules.d/system.yml 文件中修改设置。启动服务sudo metricbeat setupsudo service metricbeat startnohup ./metricbeat -e -c metricbeat.yml -d "publish" & > nohup.outkibana上查看数据
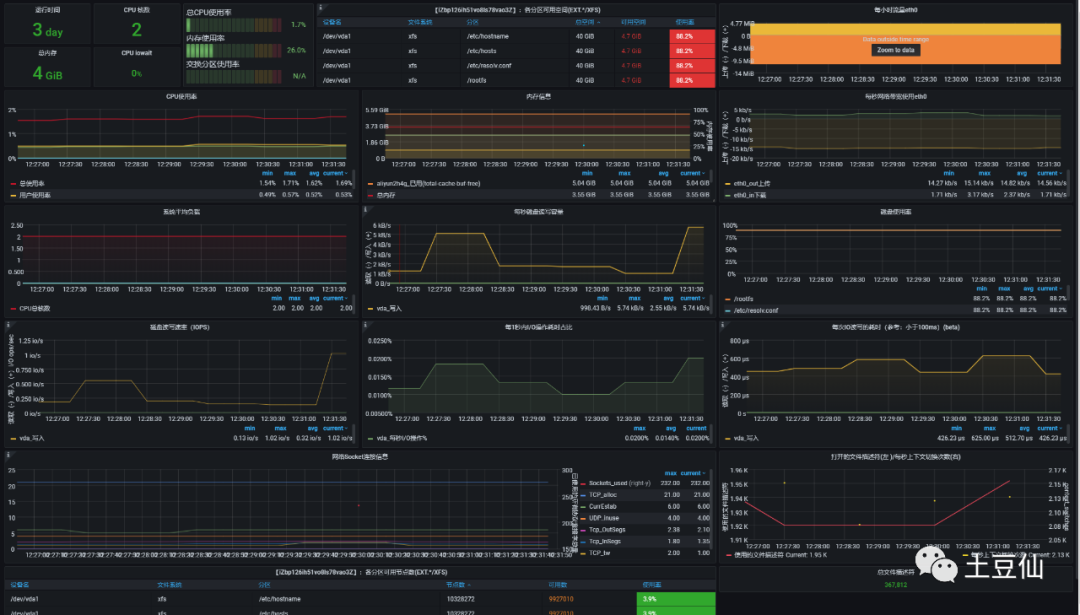
Prometheus+grafana
用于指标监控
Grafana是一款用Go语言开发的开源数据可视化工具。相比于Kibana和
Chronograf,Grafana在可视化展示层面更优秀非常多。数据源支持非常广,包括InfluxDB和mysql。
Prometheus是由SoundCloud开发的开源监控报警系统和时序列数据库。从字面上理解,Prometheus由两个部分组成,一个是监控报警系统,另一个是自带的时序数据库(TSDB)。
可以看出EFLK和普罗米修斯(Prometheus)+Grafana在日志查询和监控领域是有重叠的,不过,目前来选的话,EFLK用于日志监控检索,PG用于系统监控是不错的选择。
1. 系统监控
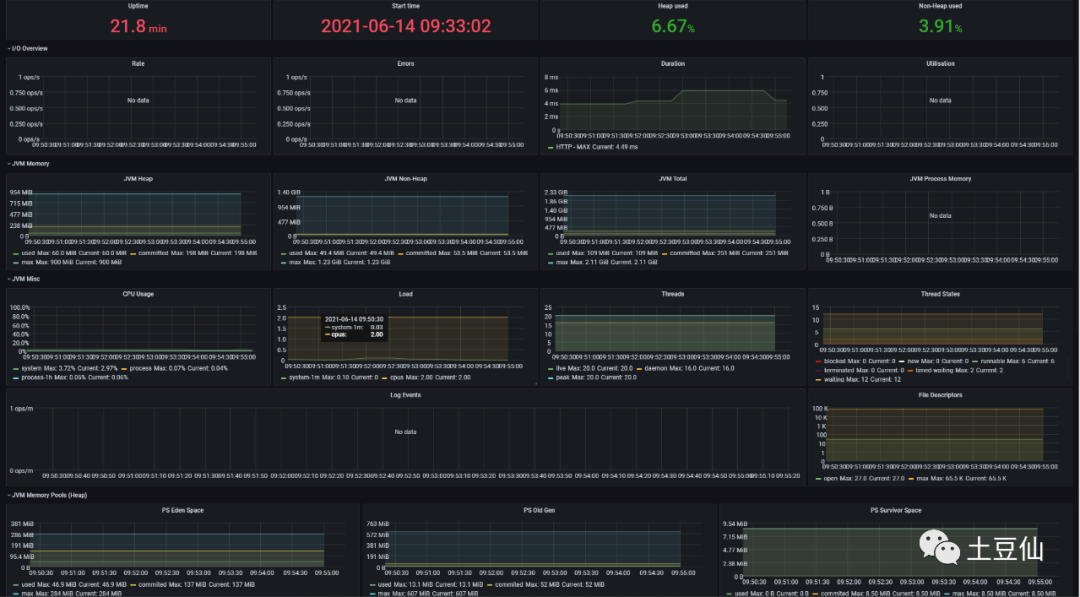
2. JVM监控
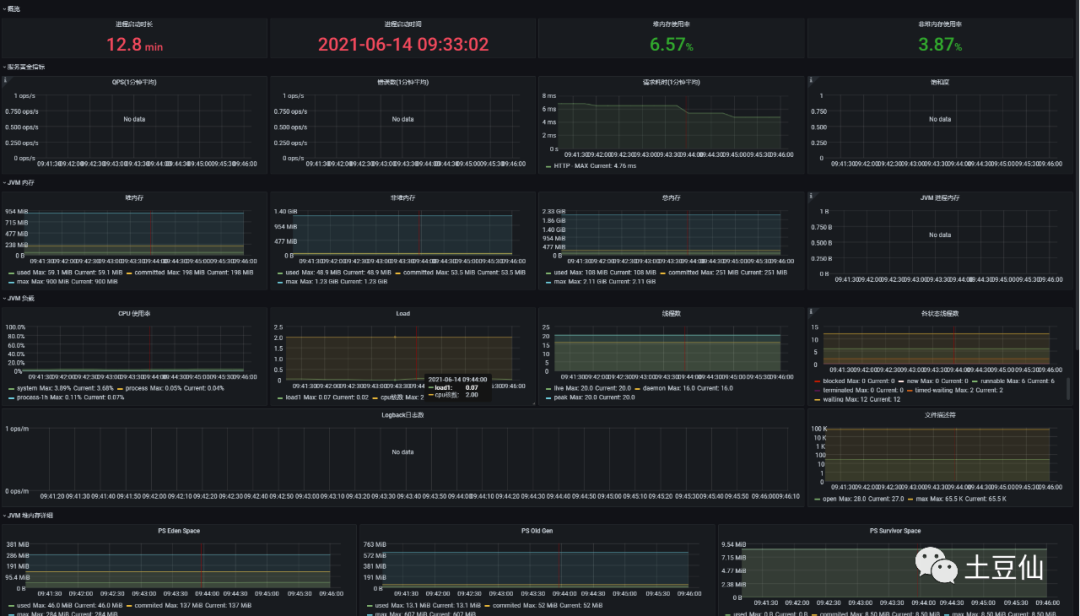
安装node-exporter、prometheus、grafana
=》仅仅提取系统指标docker run -d -p 9100:9100 \-v "/proc:/host/proc:ro" \-v "/sys:/host/sys:ro" \-v "/:/rootfs:ro" \--net="host" \prom/node-exporter=》elt转移、存储指标mkdir /opt/prometheuscd /opt/prometheus/vim prometheus.yml配置global:scrape_interval: 60sevaluation_interval: 60sscrape_configs:job_name: prometheusstatic_configs:targets: ['localhost:9090']labels:instance: prometheusjob_name: linuxstatic_configs:targets: ['ip:9100']labels:instance: localhost启动dockerdocker run -d \-p 9090:9090 \-v /opt/prometheus/prometheus.yml:/etc/prometheus/prometheus.yml \prom/prometheus展示:docker run -d --name=grafana -p 3000:3000 grafana/grafana
TICK
Telegraf + influxdb+Chronograf+Kapacitor
用于时序数据存储和监控
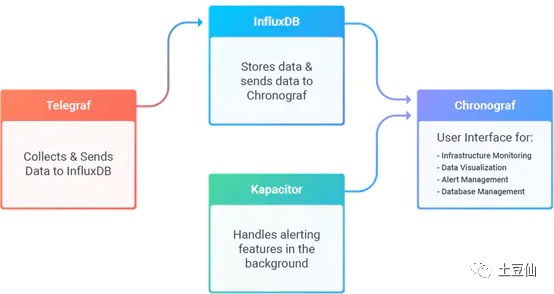
influxdb是一个开源分布式时序、时间和指标数据库,使用 Go 语言编写,无需外部依赖。其设计目标是实现分布式和水平伸缩扩展。
Telegraf 是收集和报告指标和数据的代理。有非常多的插件。Go语言编写。
Kapacitor 是一个用来处理、监控和警告时间序列数据的开源框架。
Chronograf是InfluxData的TICK堆栈的用户界面组件。
这一套可视化能力弱于grafana和Kibana,但优势在于时序数据库influxdb以及Telegraf 、Kapacitor。用于物联设备数据的存储还是非常香的。
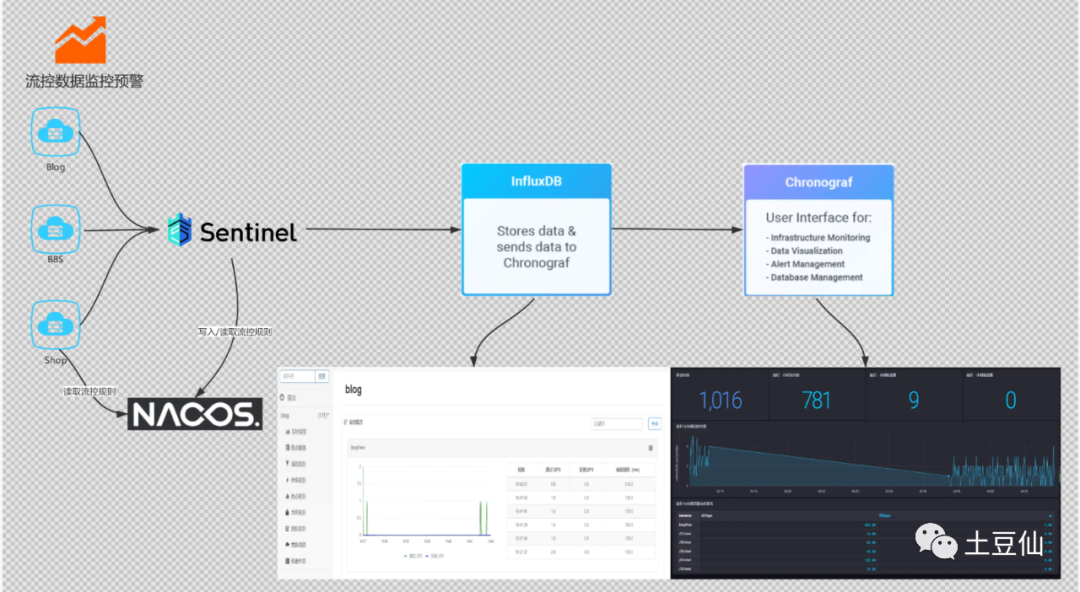
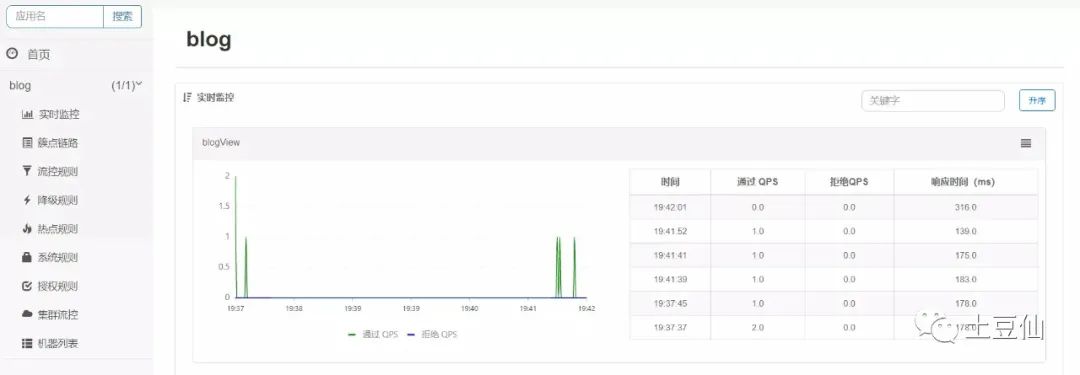
1. 集成哨兵Sentinel
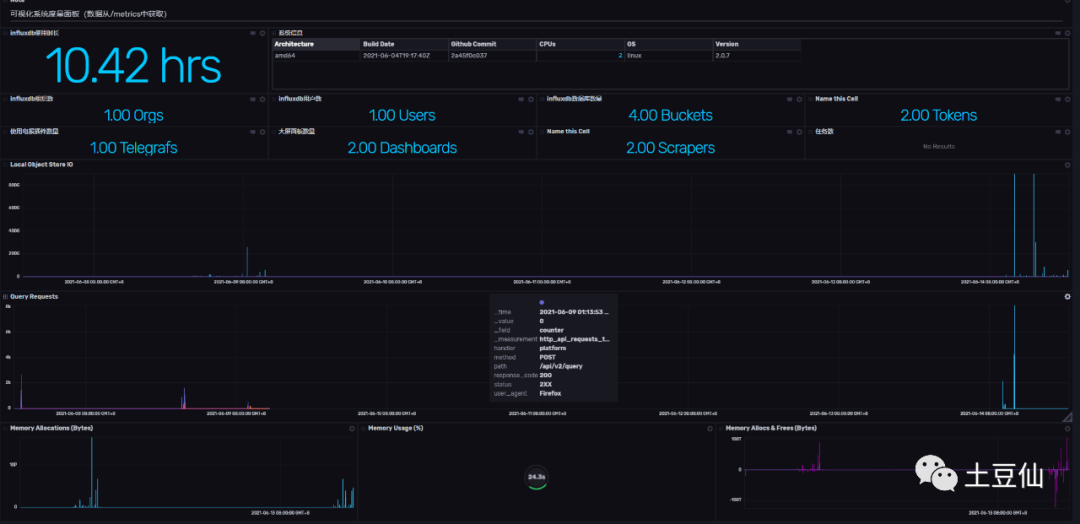
安装InfluxDB-默认集成其他组件
docker run -d -p 8083:8083 -p 8086:8086 --name my_influxdb influxdb:latestNifi or Kettle
ELT技术栈,用于业务数据流转
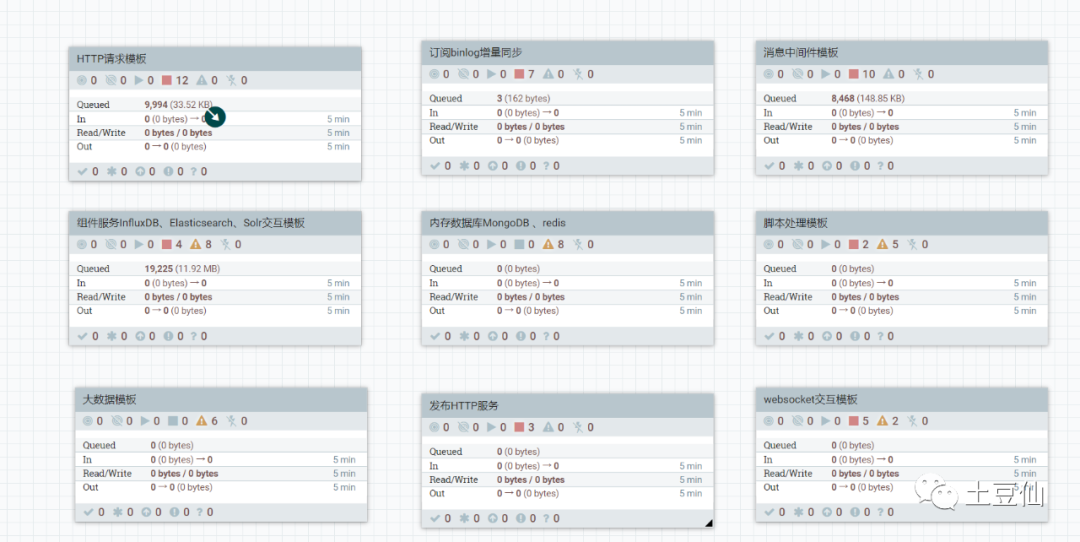
1. 处理http请求
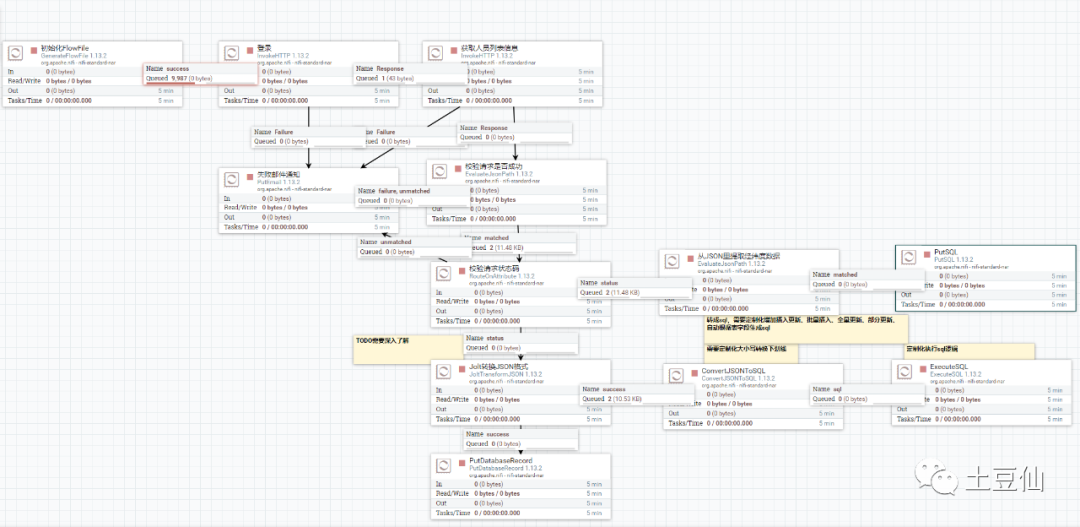
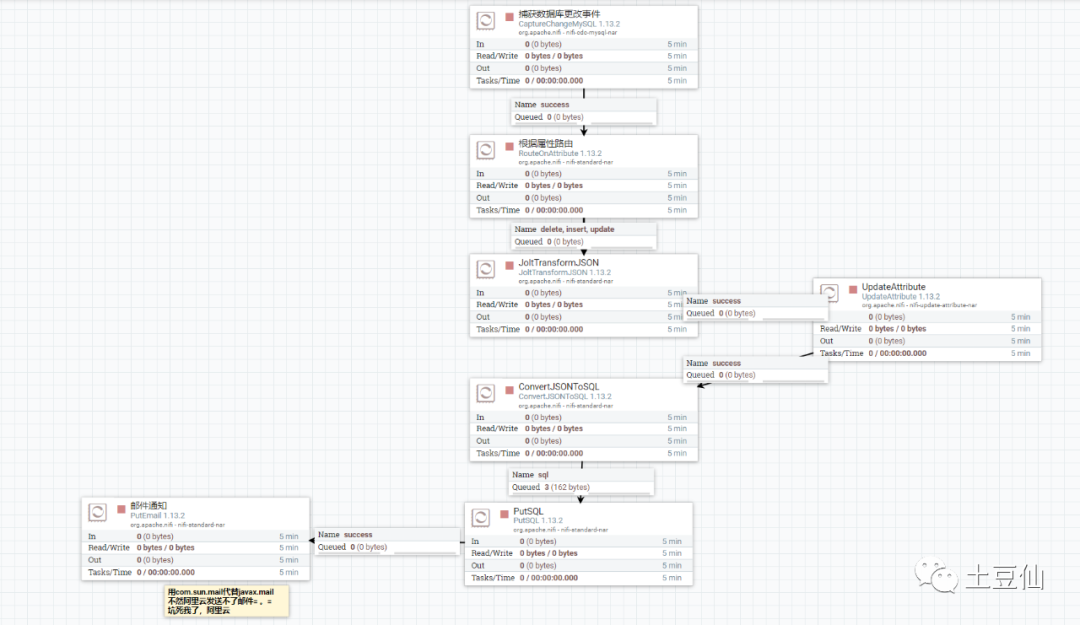
2. 订阅binlog实时同步
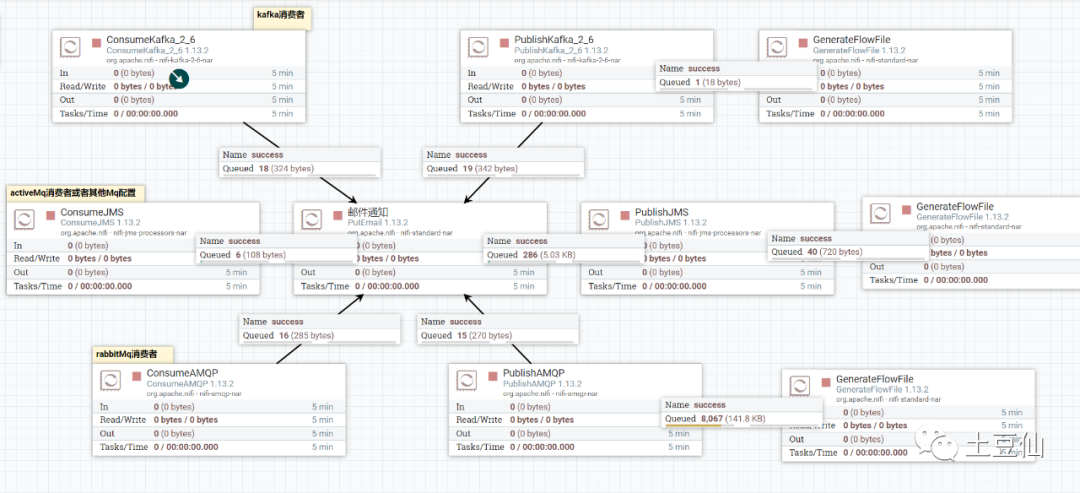
3. 消息中间件交互
4. 文件系统
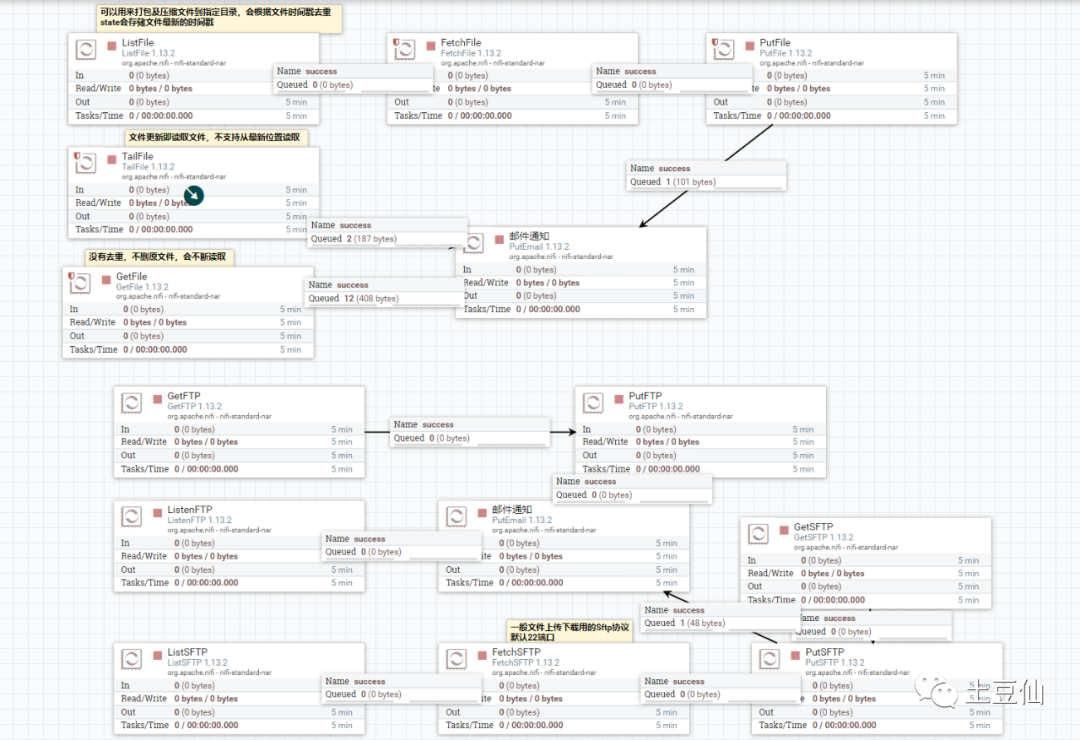
5. 其他
这里还想整理下Nifi整合Flink的模板,只能以后再搞了。
整理完上述组件,发现Go语言写的叫得上名的应用又增加了不少。Go优势还是不少呀。这里以后可以看看Go插件化方案,Grafana的前端大屏方案。
往日文章: