
Linux 运维必备的13款实用工具,赶紧收藏!


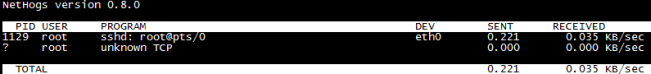
1、查看进程占用带宽情况-Nethogs
[root@localhost ~]#yum  -y install libpcap-devel  ncurses-devel
[root@localhost ~]# tar zxvf nethogs-0.8.0.tar.gz
[root@localhost ~]# cd nethogs
[root@localhost nethogs]# make && make install
[root@localhost nethogs]# nethogs eth0
2、硬盘读取性能测试-IOZone
[root@localhost current]# tar xvf iozone3_420.tar
[root@localhost ~]# cd iozone3_420/src/current/
[root@localhost current]# make linux
[root@localhost current]# ./iozone -a -n 512m -g 16g -i 0 -i 1 -i 5 -f /mnt/iozone -Rb ./iozone.xls
-a使用全自动模式 -n为自动模式设置最小文件大小(Kbytes)。 -g设置自动模式可使用的最大文件大小Kbytes。 -i用来指定运行哪个测试。 -f指定测试文件的名字完成后自动删除 -R产生Excel到标准输出 -b指定输出到指定文件上
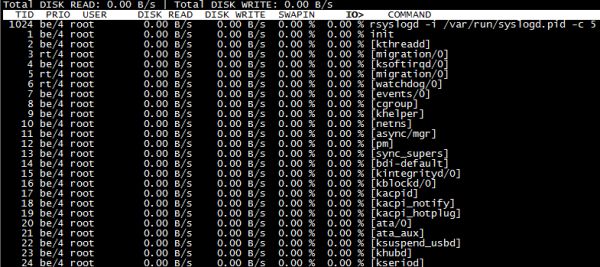
3、实时监控磁盘IO-IOTop
[root@localhost ~]# yum -y install iotop
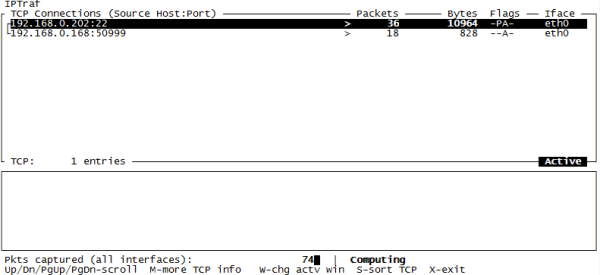
4、网络流量监控-IPtraf
[root@localhost ~]# yum -y install iptraf
5、网络流量监控-IFTop
[root@localhost ~]# tar zxvf iftop-0.17.tar.gz
[root@localhost ~]# cd iftop-0.17 [root@localhost iftop-0.17]# ./configure
[root@localhost iftop-0.17]# make && make install
[root@localhost iftop-0.17]# iftop [root@localhost iftop-0.17]# iftop -i eth0  #指定监控网卡接口
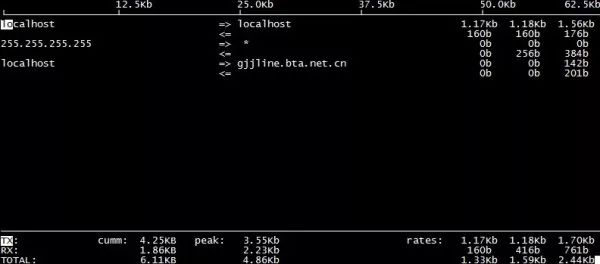
TX:发送流量 RX:接收流量 TOTAL:总流量 Cumm:运行iftop到目前时间的总流量 peak:流量峰值 rates:分别表示过去 2s 10s 40s 的平均流量
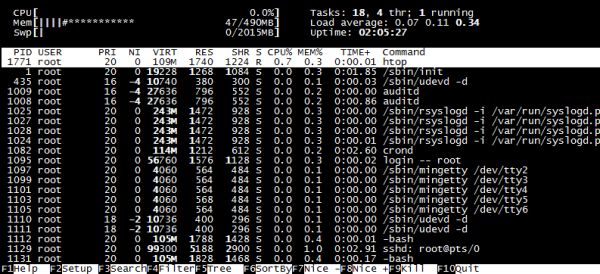
6、进程实时监控-HTop
[root@localhost ~]# yum -y install htop
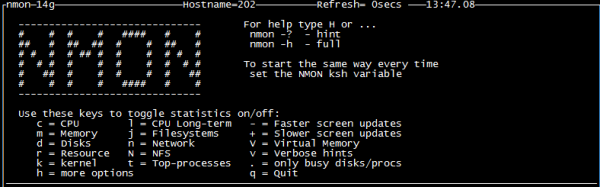
7、系统资源监控-NMON
[root@localhost ~]# chmod +x nmon_x86_64_rhel6
[root@localhost ~]# mv nmon_x86_64_rhel6 /usr/sbin/nmon
[root@localhost ~]# nmon
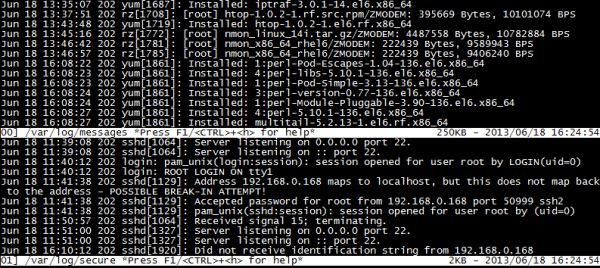
8、监控多个日志-MultiTail
[root@localhost ~]# yum -y install  multitail
[root@localhost ~]# multitail -e "fail" /var/log/secure   #筛选关键字进行监控
[root@localhost ~]# multitail -l "ping baidu.com"   #监控后面的命令-l将要执行的命令
[root@localhost ~]# multitail -i /var/log/messages -i /var/log/secure   #-i指定一个文件名
9、SSH暴力破解防护-Fail2ban
[root@localhost ~]# cd fail2ban-0.8.11
[root@localhost fail2ban-0.8.11]# python setup.py install
[root@localhost fail2ban-0.8.11]# cd files/
[root@localhost files]# cp ./redhat-initd /etc/init.d/fail2ban
[root@localhost files]# service fail2ban start
[root@localhost files]# chkconfig --add fail2ban
[root@localhost files]# chkconfig fail2ban on
[root@localhost ~]# grep -v "^#" /etc/fail2ban/jail.conf | grep -v "^$" [DEFAULT]
ignoreip = 127.0.0.1/8#忽略本机IP
bantime  = 600   #符合规则后封锁时间
findtime  = 600  #在多长时间内符合规则执行封锁如600秒达到3次则执行
maxretry = 3    #最大尝试次数
backend = auto   #日志修改检测日志gamin、polling和auto这三种
usedns = warn [ssh-iptables]
enabled  = true#默认是禁用
false filter   = sshd action   = iptables[name=SSH, port=ssh, protocol=tcp] # sendmail-whois[name=SSH,dest=收件人邮箱, sender=发件人邮箱, sendername="Fail2Ban"] logpath  = /var/log/sshd.log  #响应的错误日志一般在/var/log/secure maxretry = 5    #尝试错误次数覆盖全局中的maxretry
[root@localhost ~]# touch /var/log/sshd.log
[root@localhost ~]# service fail2ban restart
[root@localhost ~]# fail2ban-client status    #查看监控已经开启 Status |- Number of jail:      1 `- Jail list:           ssh-iptables
[root@localhost ~]# iptables -L  #iptables过滤表有fail2ban一条规则 fail2ban-SSH  tcp  --  anywhere             anywhere            tcp dpt:ssh
10、连接会话终端持续化-Tmux
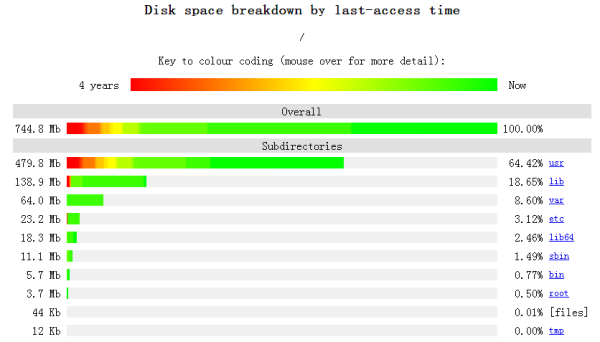
11、页面显示磁盘空间使用情况-Agedu
[root@localhost ~]# tar zxvf agedu-r9723.tar.gz
[root@localhost ~]# cd agedu-r9723
[root@localhost ~]# ./configure
[root@localhost ~]# make && make install
[root@localhost ~]# agedu -s /    #-s扫描
[root@localhost ~]# agedu -w --address 192.168.0.10:80  #-w输入一个网页链接
[root@localhost ~]# agedu -w --address 192.168.0.108080 --auth none  #--auth关闭认证如果不加端口号会生成一个随机的用浏览器访问
12、安全扫描工具-NMap
[root@localhost ~]# tar jxvf nmap-6.40.tar.bz2
[root@localhost nmap-6.40]# ./configure
[root@localhost nmap-6.40]# make && make install
[root@localhost ~]# nmap 192.168.0.10   #获取基本信息
[root@localhost ~]# nmap -O 192.168.0.10 #获取系统版本信息
[root@localhost ~]# nmap -A 192.168.0.10 #获取系统综合信息
[root@localhost ~]# nmap 192.168.0.0/24  #获取一个网段工作设备基本信息
-sSTCP扫描 -sV系统版本检测
13、Web压力测试-Httperf
[root@localhost ~]# tar zxvf httperf-0.9.0.tar.gz
[root@localhost ~]# cd httperf-0.9.0
[root@localhost httperf-0.9.0]# ./configure
[root@localhost httperf-0.9.0]# make && make install
[root@localhost ~]# httperf --hog --server=192.168.0.202 --uri=/index.html --num-conns=10000 --wsess=10,10,0.1
—hog:让httperf尽可能多产生连接,httperf会根据硬件配置,有规律的产生访问连接; —num-conns:连接数量,总发起10000请求; —wsess: 用户打开网页时间规律模拟,第一个10表示产生10个会话连接,第二个10表示每个会话连接进行10次请求,0.1表示每个会话连接请求之间的间隔时间/s。
文章转载自网络
(版权归原作者所有,侵删)
![]()

点击下方“阅读原文”查看更多
评论