vue+echarts地图使用笔记
“本篇文章是亲爱的 小朱同学 投稿的 《vue+echarts地图使用笔记》
由衷的感谢 小朱同学 的投稿,也希望更多的同学加入悲伤日记
前言
“最近我们这边要做一个高大上的数据化地图展示,并且要关联广东省市,这个以前没做过,就只能硬着头皮上了 以下的部分内容参考echarts实例demo,然后贴出来记录一下
开始
技术栈应用 vue & echarts & es6
这是官网地址示例图地址 https://echarts.apache.org/examples/zh/index.html
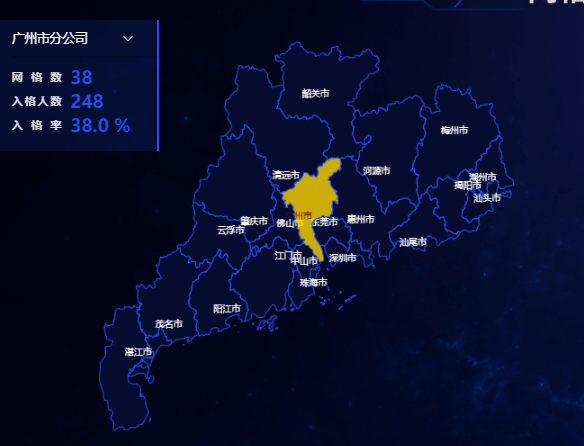
废话不多说上图:

1. 下载资源
首先,先去把地图渲染的数据搞定 这是找到地图的数据链接 可以做广东的也可以做 全国或者 其他省份,地区(市区都可以的)
http://datav.aliyun.com/tools/atlas/#&lat=22.88859114953859&lng=113.42039808259088&zoom=7.5
然后下面这个链接是下载数据的,保存在本地即可
https://geo.datav.aliyun.com/areas_v2/bound/440000.json
2. 添加容器
html 部分
<div id="main" style="width: 50%; height: 480px"></div>
3. 引入资源
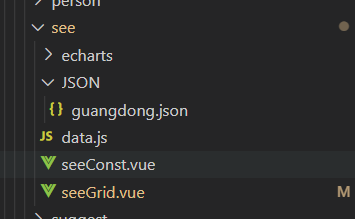
并且把刚才下载的 json数据 保存在本地

其中的 guangdong.json 就是了,在data引入
geoJson: require("./JSON/guangdong.json"), //地图json数据
引入之后
4. 开始折腾
在生命周期请求后台数据,等待请求返回之后再开始 初始化并完成渲染
“代码有点多,仔细看注释
chinamap() {
    let series = [];
    // 基于准备好的dom,初始化echarts实例
    const _this = this;
    // 在用户点击的时候 this会指向 nudefind,所以提前备份确认this指向vue实例
    const user_data = sessionStorage.getItem("user_data")
        ? JSON.parse(sessionStorage.getItem("user_data"))
        : {};
    this.user_data = user_data;
    const { roleString, company } = this.user_data[0];
    //   获取echarts 的跟节点,此处的所有东西都是在这个根节点完成
    const myChart = this.$echarts.init(document.getElementById("main"));
    myChart.clear(); //清除画布
    // 然后再重新画画布
    _this.$echarts.registerMap("广东", this.geoJson);
    const mapData = this.mapData;
    myChart.hideLoading();
    let option = {
        tooltip: {
            // 窗口外框
            backgroundColor: "rgba(0,0,0,0)",
            trigger: "item",
        },
        legend: {
            show: false,
        },
        // 主要配置
        series: [
            {
                tooltip: {
                    // 显示的窗口
                    trigger: "item",
                    position: [10, 10], // 提示框的位置
                    formatter: function (item) {
                        return ""; // 取消外框,自己写一个外框提示根据用户点击的城市获取,再匹配数据,
                        //此处 可以接受一个function(param) { return ""} 返回一个模板字符串,
                    },
                },
                name: "广东省数据",
                type: "map",
                map: "广东", // 自定义扩展图表类型
                zoom: 0.65, //缩放
                showLegendSymbol: true,
                label: {
                    // 文字 的显隐和大小颜色
                    show: true,
                    color: "#fff",
                    fontSize: 10,
                },
                //地图样式
                itemStyle: adminPermissionArray.includes(roleString)
                    ? _this.itemStyle
                    : _this.itemStyle_normal,
                emphasis: adminPermissionArray.includes(roleString)
                    ? _this.emphasis_normal
                    : _this.emphasis,
                layoutCenter: ["50%", "50%"], // 地图的位置
                layoutSize: "150%", // 缩放比
                markPoint: {
                    symbol: "none",
                },
                data: _this.normalData,  //  这个控制着默认展示,用于左边的下拉框展示默认颜色
            },
        ],
    };
    // 配置项结束
    series.push();
    _this.showTips("广州市");
    myChart.off("click"); //解绑点击事件
    myChart.on("click", function (params) {
        // console.log(params.name); // 获取用户点击了那个市区  如: 广州市
        const { mapData } = _this; // 这个是后台返回的数据
        if (adminPermissionArray.includes(roleString)) {
            _this.mapData.forEach((v) => {
                if (v.name.indexOf(params.name) !== -1) {
                    _this.selectObj = v;
                }
            });
            // 查询 选择的入格人数和入格率
            _this.CityDroppedRate.forEach((v) => {
                if (v.orgName.indexOf(params.name) !== -1) {
                    _this.selectObj.rate = v.rate;
                    _this.selectObj.droppedCount = v.droppedCount;
                }
            });
        } else {
            if (company.indexOf(params.name) !== -1) {
                _this.mapData.forEach((v, i) => {
                    if (v.name.indexOf(params.name) !== -1) {
                        _this.cityIndex = i;
                        _this.selectObj = v;
                        _this.OptionDatas.forEach((vv, ii) => {
                            if (vv.label.indexOf(params.name)) {
                                _this.form.cityOrgCode = vv.value;
                            }
                        });
                        _this.getData();
                    }
                });
                // 查询 选择的入格人数和入格率
                _this.CityDroppedRate.forEach((v) => {
                    if (v.orgName.indexOf(params.name) !== -1) {
                        _this.selectObj.rate = v.rate;
                        _this.selectObj.droppedCount = v.droppedCount;
                    }
                });
            } else {
                _this.$message({
                    showClose: true,
                    message: "暂无查看其他市的权限",
                    type: "error",
                });
            }
        }
    });
    option.series = series.concat(option.series);
    myChart.on("mouseover", function (params) { }); // 此处跟点击事件一致
    myChart.setOption(option); // 必须再次传入 进echarts,
}
这个是 主要的渲染逻辑,其中还有一些颜色和配置是根据需求的需要,放在data里面传进来,方便修改颜色 主要是点击了地图还控制其他的地图和饼状图的数据展示,故点击事件写的比较多和乱
下面补充上
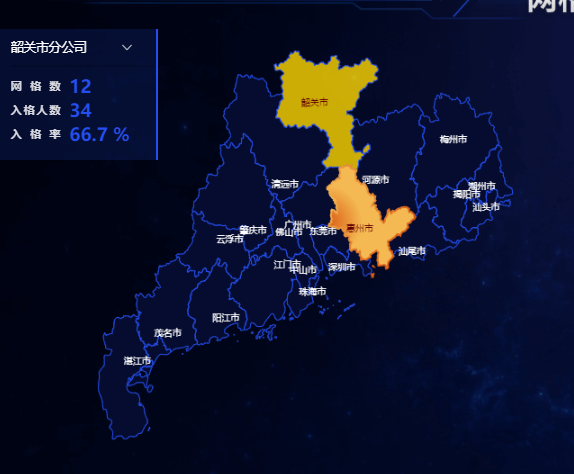
“这是灰色的,没颜色状态;低亮 高亮颜色就换换而已,就不浪费时间了
 itemStyle: {
  areaColor: {  // 高亮的颜色
   type: 'radial',
   x: 0,
   y: 0.5,
   r: 0.4,
   colorStops: [{
    offset: 1, color: '#f4b952' // 100% 处的颜色
   }, {
    offset: 0, color: '#d95914' // 0% 处的颜色
   }],
   global: false // 缺省为 false
  },
  borderColor:  {  // 高亮边框的颜色
   type: 'radial',
   x: 0,
   y: 0.3,
   r: 1,
   colorStops: [{
    offset: 0, color: '#f4b952' // 100% 处的颜色
   }, {
    offset: 1, color: '#d95914' // 0% 处的颜色
   }],
   global: false // 缺省为 false
  },
  borderWidth: 2
 },
 itemStyle_normal: {  //地图样式
  normal: {
   borderColor:  '#244eef',
   borderWidth: 1,
   areaColor:'#060c30',
  },
 },
 emphasis_normal: {  //地图样式
  show:true,
  itemStyle: {
   areaColor:'#060c30',
   borderColor: '#244eef',
   borderWidth: 2,
   label: "#fff",
   color: "#fff",
  },
 },
补充 一个完成的功能那个图 点击之后一个颜色,鼠标移动一个颜色,关联的数据 也变化,并控制着其他的展示数据也变化,并且左边的下拉框 也可以控制地图的显隐和默认高亮颜色

this.normalData = [{ name: '广州市', selected: true }]; // 此处对应上面的 normalData 传入即可控制默认展示
注意事项:
如果要做 tooltip 记得传入的data 数组对象要包含 name 和 value的键值对如
this.mapData = res.data.map(v => {
    return {
        value: Number(v.gridCount),
        name: v.orgName,
        orgCode: v.orgCode,
    };
});
最后
再一次感谢 小朱同学 的笔记分享
评论
