
临时抱佛脚,线上问题如何排查?
磁盘空间不足问题
文件系统        容量  已用  可用 已用% 挂载点
devtmpfs        1.9G  4.0K  1.9G    1% /dev
tmpfs           1.9G   24K  1.9G    1% /dev/shm
tmpfs           1.9G  740K  1.9G    1% /run
tmpfs           1.9G     0  1.9G    0% /sys/fs/cgroup
/dev/vda1        50G   12G   36G   25% /
tmpfs           379M     0  379M    0% /run/user/0
tmpfs           379M     0  379M    0% /run/user/1001
/dev/loop4 1003K 17K 935K 2% /mnt0 bin
166M boot
134M data
4.0K dev
40M etc
4.0K home
0 lib
0 lib64
16K lost+found
4.0K media
du: 无法访问"mnt/hello": 输入/输出错误
13K mnt
20K opt
du: 无法访问"proc/12896/task/12896/fd/4": 没有那个文件或目录
du: 无法访问"proc/12896/task/12896/fdinfo/4": 没有那个文件或目录
du: 无法访问"proc/12896/fd/4": 没有那个文件或目录
du: 无法访问"proc/12896/fdinfo/4": 没有那个文件或目录
0 proc
953M root
740K run
0 sbin
4.0K srv
2.1G swapfile
0 sys
68K tmp
5.3G usr
2.9G vardrwxr-x--- 2 www www 4.0K 2 月 3 14:56 hsperfdata_www
srwxrwxrwx 1 mysql mysql 0 2 月 3 14:56 mysql.sock
-rw-r--r-- 1 root root 0 6 月 19 15:33 stargate.lock
drwx------ 3 root root 4.0K 2 月 3 14:55 systemd-private
CPU 与内存使用率过高问题
到了我临场发挥时,唯一能记得住的命令了,那就是 top。
CPU 与内存使用率过高问题
top - 20:16:56 up 141 days,  5:21,  1 user,  load average: 0.00, 0.01, 0.05
Tasks: 110 total,   1 running, 109 sleeping,   0 stopped,   0 zombie
%Cpu(s):  0.2 us,  0.5 sy,  0.0 ni, 99.3 id,  0.0 wa,  0.0 hi,  0.0 si,  0.0 st
KiB Mem :  3880160 total,   135320 free,   852980 used,  2891860 buff/cache
KiB Swap:  2097148 total,  2087676 free,     9472 used.  2737524 avail Mem


  PID USER      PR  NI    VIRT    RES    SHR S  %CPU %MEM     TIME+ COMMAND
 11866 root      20   0  611652  14280   2396 S   0.7  0.4 239:17.79 barad_agent
 16850 root      20   0 1026344  22364  11644 S   0.7  0.6   5:04.40 YDService
 1550 root      20   0  140996   2428   1472 S   0.3  0.1  58:38.76 redis-server
 1575 www       20   0 3610540 358456  14912 S   0.3  9.2 153:55.63 java
 16868 root      20   0  773168  12576  11056 S   0.3  0.3   1:15.83 YDEdr
19063 jar
1575 Bootstrap
21263 Jps
top - 20:51:07 up 141 days,  5:55,  3 users,  load average: 0.09, 0.
Tasks:   1 total,   0 running,   1 sleeping,   0 stopped,   0 zombie
%Cpu(s):  0.7 us,  0.3 sy,  0.0 ni, 99.0 id,  0.0 wa,  0.0 hi,  0.0
KiB Mem :  3880160 total,   139956 free,   952180 used,  2788024 buf
KiB Swap:  2097148 total,  2087420 free,     9728 used.  2638260 ava


  PID USER      PR  NI    VIRT    RES    SHR S  %CPU %MEM     TIME+
19063 root      20   0 3533736 101916  13012 S   0.3  2.6   0:04.31
top - 20:52:16 up 141 days,  5:56,  3 users,  load average: 0.03, 0.
Threads:  22 total,   0 running,  22 sleeping,   0 stopped,   0 zomb
%Cpu(s):  0.0 us,  0.0 sy,  0.0 ni,100.0 id,  0.0 wa,  0.0 hi,  0.0
KiB Mem :  3880160 total,   140136 free,   951924 used,  2788100 buf
KiB Swap:  2097148 total,  2087420 free,     9728 used.  2638512 ava


  PID USER      PR  NI    VIRT    RES    SHR S %CPU %MEM     TIME+
19063 root      20   0 3533736 101920  13012 S  0.0  2.6   0:00.00
19064 root      20   0 3533736 101920  13012 S  0.0  2.6   0:01.16
19065 root      20   0 3533736 101920  13012 S  0.0  2.6   0:00.01
19066 root      20   0 3533736 101920  13012 S  0.0  2.6   0:00.01
19067 root      20   0 3533736 101920  13012 S  0.0  2.6   0:00.02
19068 root      20   0 3533736 101920  13012 S  0.0  2.6   0:00.00
19069 root      20   0 3533736 101920  13012 S  0.0  2.6   0:00.00
              total        used        free      shared  buff/cache   available
Mem:           3.7G        934M        155M        500K        2.6G        2.5G
Swap:          2.0G        9.5M        2.0G
total:内存总数
used:已经使用内存数
free:完全空闲内存
shared:多个进程共享的内存
buffers:用于块设备数据缓冲,记录文件系统 metadata(目录,权限,属性等)
cached:用于文件内容的缓冲
available:真正剩余的可被程序应用的内存数
NAME      TYPE SIZE USED PRIO
/swapfile file   2G 9.5M   -2
网络延迟
网络延迟
Active Internet connections (servers and established)
Proto Recv-Q Send-Q Local Address           Foreign Address         State
tcp        0      0 0.0.0.0:mysql           0.0.0.0:*               LISTEN
tcp        0      0 VM-0-12-centos:6379     0.0.0.0:*               LISTEN
tcp        0      0 VM-0-12-centos:memcache 0.0.0.0:*               LISTEN
tcp        0      0 0.0.0.0:http            0.0.0.0:*               LISTEN
tcp        0      0 0.0.0.0:ftp             0.0.0.0:*               LISTEN
tcp        0      0 0.0.0.0:ssh             0.0.0.0:*               LISTEN
tcp        0      0 VM-0-12-centos:smtp     0.0.0.0:*               LISTEN
tcp        0      0 0.0.0.0:irdmi           0.0.0.0:*               LISTEN
tcp        0      0 VM-0-12-centos:12419    169.254.0.4:http        TIME_WAIT
tcp        0      0 VM-0-12-centos:ssh      114.247.175.201:8829    ESTABLISHED
tcp        0      0 VM-0-12-centos:64390    169.254.0.55:lsi-bobcat ESTABLISHED
tcp        0      0 VM-0-12-centos:ssh      114.247.175.201:14227   ESTABLISHED
tcp        0      0 VM-0-12-centos:ssh      114.247.175.201:22704   ESTABLISHED
tcp        0     36 VM-0-12-centos:ssh      114.247.175.201:15126   ESTABLISHED
tcp6       0      0 [::]:webcache           [::]:*                  LISTEN
tcp6       0      0 [::]:ftp                [::]:*                  LISTEN
tcp6       0      0 VM-0-12-centos:smtp     [::]:*                  LISTEN
tcp6       0      0 [::]:irdmi              [::]:*                  LISTEN
tcp6       0      0 VM-0-12-centos:8006     [::]:*                  LISTEN
udp        0      0 0.0.0.0:bootpc          0.0.0.0:*
udp        0      0 VM-0-12-centos:ntp      0.0.0.0:*
udp        0      0 VM-0-12-centos:ntp      0.0.0.0:*
udp6       0      0 VM-0-12-centos:ntp      [::]:*
udp6 0 0 VM-0-12-centos:ntp [::]:*Active Internet connections (servers and established)
Proto Recv-Q Send-Q Local Address Foreign Address State PID/Program name
tcp 0 0 0.0.0.0:3306 0.0.0.0:* LISTEN 2903/mysqld
tcp 0 0 127.0.0.1:6379 0.0.0.0:* LISTEN 32647/redis-server
tcp 0 0 127.0.0.1:11211 0.0.0.0:* LISTEN 1240/memcached
tcp 0 0 0.0.0.0:80 0.0.0.0:* LISTEN 1030/nginx: master
tcp 0 0 0.0.0.0:21 0.0.0.0:* LISTEN 1016/pure-ftpd
tcp 0 0 0.0.0.0:22 0.0.0.0:* LISTEN 1201/sshd
tcp 0 0 127.0.0.1:25 0.0.0.0:* LISTEN 1502/master
tcp 0 0 0.0.0.0:8000 0.0.0.0:* LISTEN 1550/./redis-server
tcp 0 0 172.21.0.12:22 114.247.175.201:8829 ESTABLISHED 18961/sshd: root@no
tcp 0 0 172.21.0.12:64390 169.254.0.55:5574 ESTABLISHED 16850/YDService
tcp 0 0 172.21.0.12:22 114.247.175.201:14227 ESTABLISHED 9490/sshd: root@not
tcp 0 0 172.21.0.12:22 114.247.175.201:22704 ESTABLISHED 20259/sshd: root@no
tcp 0 36 172.21.0.12:22 114.247.175.201:15126 ESTABLISHED 9478/sshd: root@pts
tcp6 0 0 :::8080 :::* LISTEN 1575/java
tcp6 0 0 :::21 :::* LISTEN 1016/pure-ftpd
tcp6 0 0 ::1:25 :::* LISTEN 1502/master
tcp6 0 0 :::8000 :::* LISTEN 1550/./redis-server
tcp6 0 0 127.0.0.1:8006 :::* LISTEN 1575/java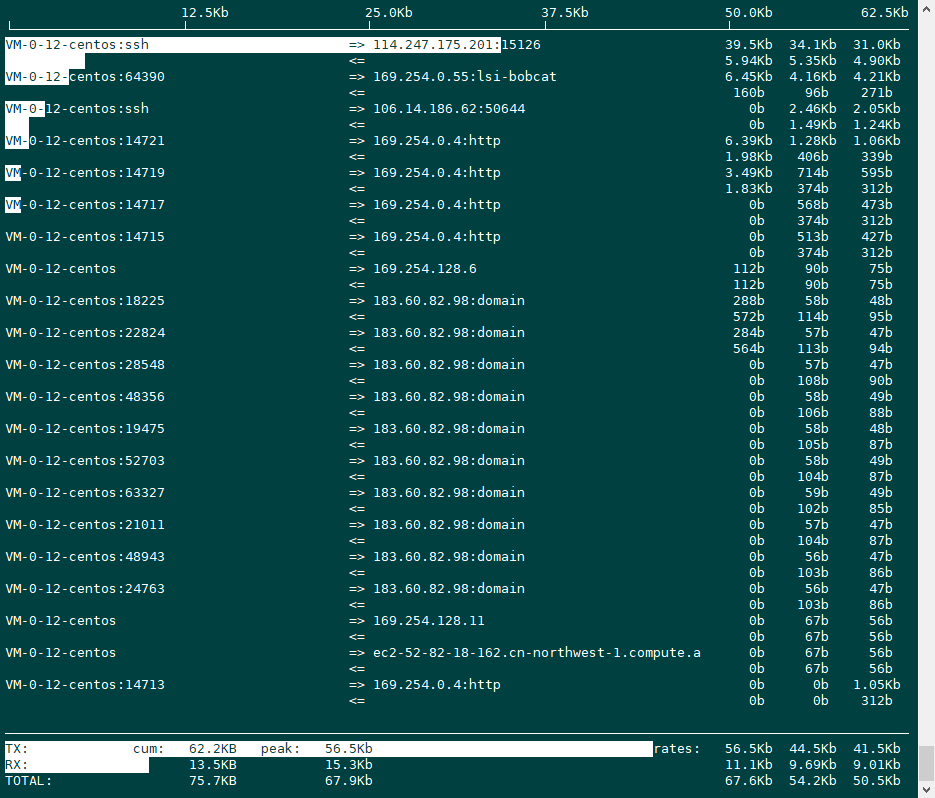
TX:发送流量
RX:接收流量
TOTAL:总流量
Cumm:运行 iftop 到目前时间的总流量
peak:流量峰值
rates:分别表示过去 2s 10s 40s 的平均流量
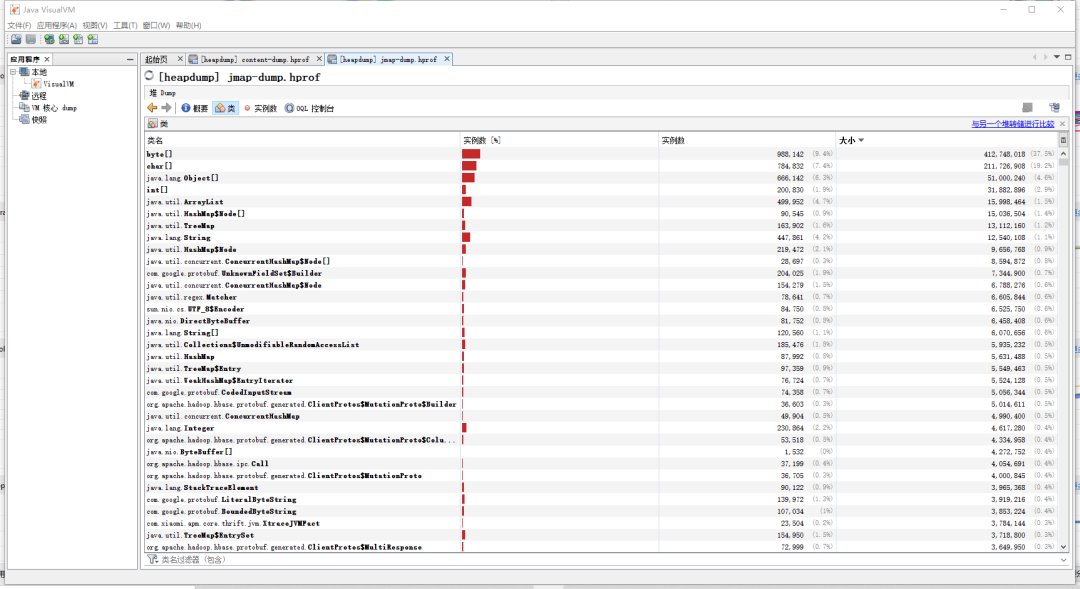
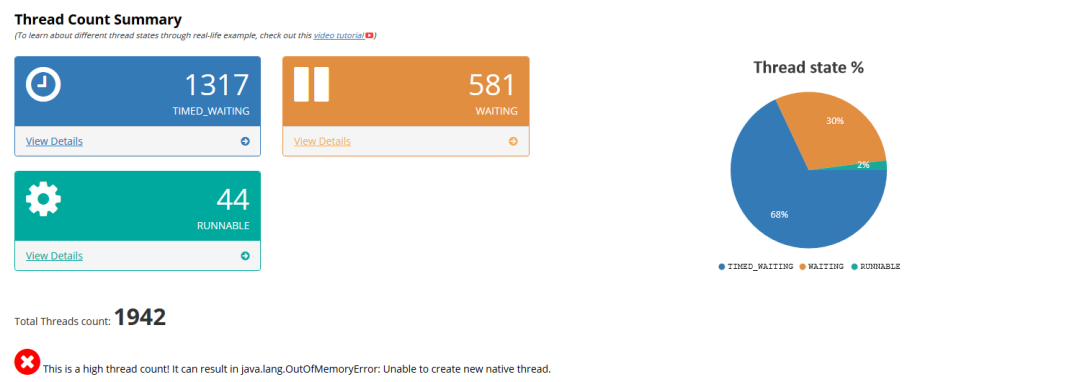
Java 程序的问题分析
Java 程序的问题分析
Attaching to process ID 127, please wait...
Debugger attached successfully.
Server compiler detected.
JVM version is 25.202-b08

using thread-local object allocation.
Parallel GC with 4 thread(s)

Heap Configuration:
   MinHeapFreeRatio         = 0
   MaxHeapFreeRatio         = 100
   MaxHeapSize              = 6442450944 (6144.0MB)
   NewSize                  = 2147483648 (2048.0MB)
   MaxNewSize               = 2147483648 (2048.0MB)
   OldSize                  = 4294967296 (4096.0MB)
   NewRatio                 = 2
   SurvivorRatio            = 8
   MetaspaceSize            = 21807104 (20.796875MB)
   CompressedClassSpaceSize = 1073741824 (1024.0MB)
   MaxMetaspaceSize         = 17592186044415 MB
   G1HeapRegionSize         = 0 (0.0MB)

Heap Usage:
PS Young Generation
Eden Space:
   capacity = 2117074944 (2019.0MB)
   used     = 1150960080 (1097.6410675048828MB)
   free     = 966114864 (921.3589324951172MB)
   54.36558036180698% used
From Space:
   capacity = 15204352 (14.5MB)
   used     = 13860864 (13.21875MB)
   free     = 1343488 (1.28125MB)
   91.16379310344827% used
To Space:
   capacity = 15204352 (14.5MB)
   used     = 0 (0.0MB)
   free     = 15204352 (14.5MB)
   0.0% used
PS Old Generation
   capacity = 4294967296 (4096.0MB)
   used     = 188289400 (179.56676483154297MB)
   free     = 4106677896 (3916.433235168457MB)
   4.383954219520092% used

23604 interned Strings occupying 2341024 bytes.
一些无法本地 debug 的调试技巧
一些无法本地 debug 的调试技巧
评论