△点击上方“Python猫”关注 ,回复“2”加入交流群来源: 机器之心
下一代数据科学开发环境 Jupyter Lab 应该怎么用?让我们从扩展工具开始。

如果你是一个用 Python 的数据科学家,那么用 Jupyter Notebook 就是大概率事件了。作为 Jupyter Notebook 的「下一代」web 应用,Jupyter Lab 提供了相比以往更多的便捷功能,其中之一就是扩展。现在,即使是 Jupyter Lab 开发者团队也对如此蓬勃发展的第三方扩展工具社区而感到兴奋了。在这篇文章中,机器学习工程师、计算机科学博士 Christopher Tao 将为读者介绍 10 种 Jupter Lab 扩展工具,它们对于典型的数据科学家 / 工程师来说可以大幅提高生产力。
目前,大多数在线资源都会使用以下命令来安装 Jupyter Lab 扩展:jupyter labextension install @jupyterlab/...
当然,很多人都喜欢使用这种命令。如果你是 VS-Code、Sublime 或 Atom 的用户,你也许会希望在「管理器」中直接搜索要安装的内容。Jupyter Lab 却没有提供这些功能。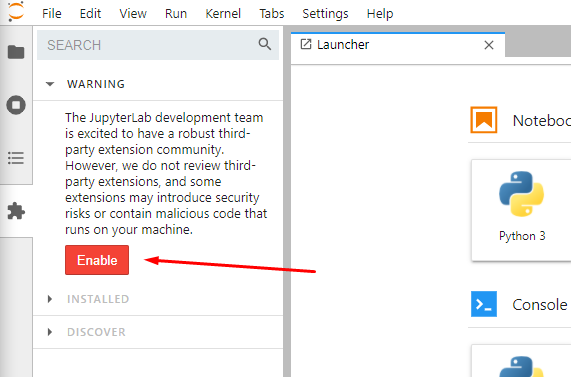
如上图所示,你可以转到左侧导航栏第 4 个选项卡,即扩展管理器(extension manager)。然后就可以搜索到你需要的扩展。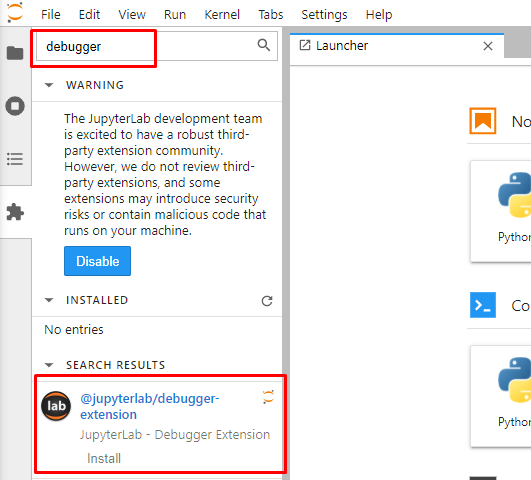
现在总结一下值得推荐的 10 个 Jupyter Lab 扩展。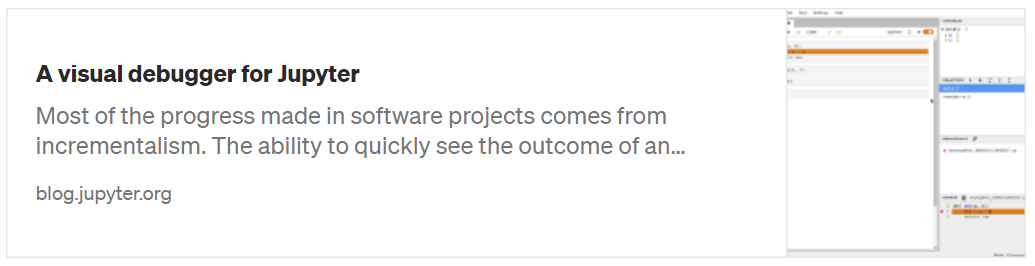
调试器指南:https://blog.jupyter.org/a-visual-debugger-for-jupyter-914e61716559由于 Jupyter 的交互性,它受到了很多人的喜欢。然而,调试功能是编码所必须的。例如,我们可以逐步调试 for 循环(for-loop )来查看内部发生了什么。大多数 IDE 工具都支持这种带有「step over」和「step into」的调试特性,但遗憾的是,Jupyter 中没有这种特性。「jupyterlab/debugger」就是这样一个扩展,让我们可以补足 Jupyter Lab 中缺少的这个功能。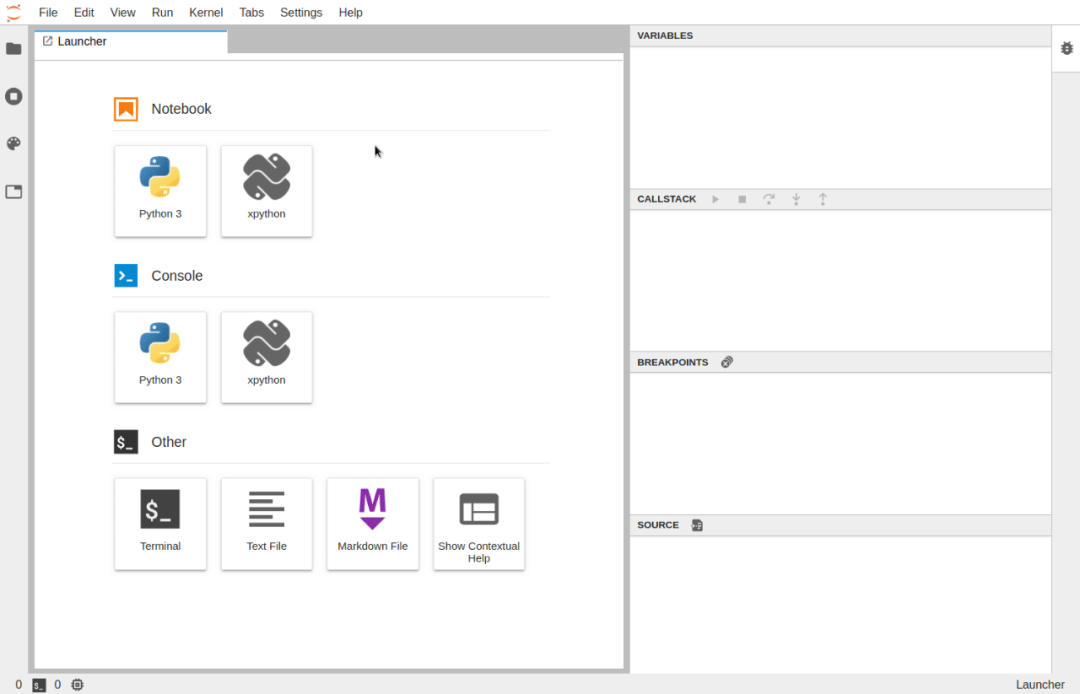
图源:https://blog.jupyter.org/a-visual-debugger-for-jupyter-914e61716559
JupyterLab-TOC 项目地址:https://github.com/jupyterlab/jupyterlab-tocnotebook 太长?想让你的 notebook 看起来更漂亮?或者希望 notebook 有一个目录?「jupyterlab/toc」帮你实现。
图源: https://github.com/jupyterlab/jupyterlab-toc/raw/master/toc.gif有了这个扩展,基于用标题标记的单元格会自动生成目录(确保使用标记 ## 来指定你的标题级别)。这也是使用 Jupyter Notebook 的好方法,让你的工作更有系统性和组织性。
JupyterLab-DrawIO 项目地址:https://github.com/QuantStack/jupyterlab-drawioDiagram.net(原名 Draw.IO)是绘制图表的工具,它确实是 MS Visio 完美的开源替代品。借助于 jupyterlab-drawio,我们可以在 Jupyter Lab 上使用该工具。
图源:https://github.com/QuantStack/jupyterlab-drawio/raw/master/drawio.gif
JupyterLab Execution Time
JupyterLab Execution Time 项目地址:https://github.com/deshaw/jupyterlab-execute-timeJupyter Notebook/Lab 的一个惊人特性是它能提供许多有用的魔术命令(magic command)。例如我们可以使用「%timeit」测试代码运行时间。它将运行代码片段数百或数千次,并得到平均值,以确保给出一个公平和准确的结果。但有时并不需要这样精确。我们只不过想知道每个单元运行的时间,在这种情况下,为每个单元使用「%timeit」变得不合适了。在这种情况下,我们可以使用「jupyterlab-execute-time」。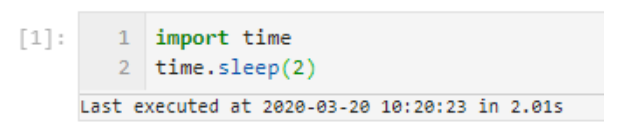
如上图所示,「jupyterlab-execute-time」不仅显示了执行单元的时间间隔,而且还显示了最后执行的时间。
JupyterLab Spreadsheet 项目地址:https://github.com/quigleyj97/jupyterlab-spreadsheet作为一名数据科学家或数据工程师,你不得不与电子表格打交道。但是,Jupyter 本身不支持读取 Excel 文件,这迫使我们需要打开多个工具,在 Jupyter 编码以及 Excel 之间不停地切换。「jupyterlab-spreadsheet」可以很好地解决这类问题。它在 Jupyter Lab 中嵌入了 xls/xlsx 电子表格查看功能,因此我们可以在同一个地方获得所需的一切。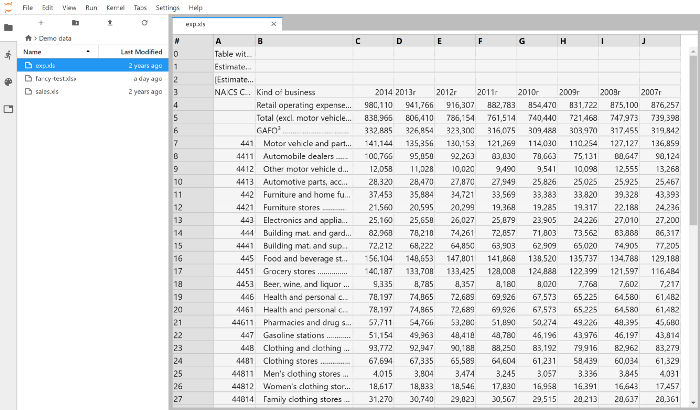
图源: https://github.com/quigleyj97/jupyterlab-spreadsheet/raw/main/screenshot.pngJupyterLab System Monitor
jupyterlab-system-monitor 项目地址:https://github.com/jtpio/jupyterlab-system-monitorPython 不是一种高效执行的编程语言,这意味着与其他语言相比,它可能会消耗更多的 CPU 和内存资源。Python 的最常见用例之一是数据科学。所以,我们可能想要监控自身系统硬件资源,从而注意到 Python 代码可能冻结了操作系统。jupyterlab-topbar-extension 你想要拥有的扩展,它可以在 Jupyter Lab UI 的顶部栏显示 CPU 和内存使用情况,这样我们就可以实时监控了。如下动图所示:
图源:https://github.com/jtpio/jupyterlab-system-monitor/raw/main/doc/screencast.gif
jupyterlab-kite 项目地址:https://github.com/kiteco/jupyterlab-kite虽然我很喜欢 Jupyter,但它不像其他经典 IDE 工具一样提供代码自动补全功能。Jupyter 的代码自动补全非常受限且速度很慢。你可能听说过免费的 AI 赋能代码补全服务 Kite,它在 Sublime、VS Code 和 PyCharm 等几乎所有流行的 IDE 工具中都可以使用。通过 jupyterlab-kite (https://github.com/kiteco/jupyterlab-kite) 扩展,你也可以在 Jupyter Lab 中使用这一功能。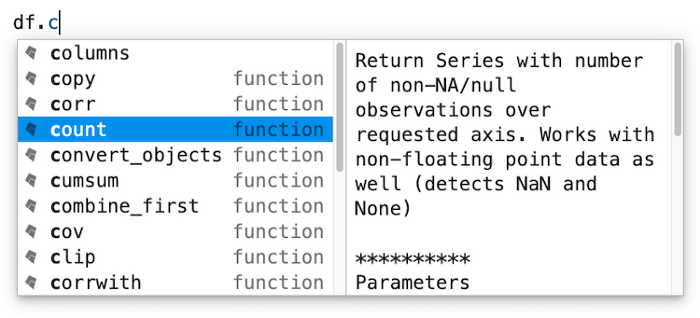
图源:https://github.com/kiteco/jupyterlab-kiteJupyterLab Variable Inspector
jupyterlab-variableInspector 项目地址:https://github.com/lckr/jupyterlab-variableInspector如果你是从 R studio 或 Matlab 转向使用 Jupyter Lab 的数据科学家,则可能对这些工具提供的变量检测器非常熟悉。但遗憾的是,Jupyter Lab 默认不支持这一功能。这时,jupyterlab-variableInspector 扩展可以重新支持该功能。
图源:https://github.com/lckr/jupyterlab-variableInspector/raw/master/early_demo.gif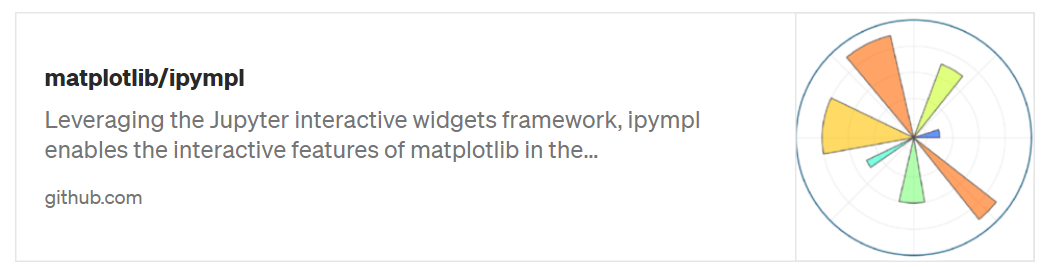
Matplotlib/ipympl 项目地址:https://github.com/matplotlib/ipympl如果你是数据科学家,则 Matplotlib 是必须学习(must-learn)的 Python 库。该库是 Python 中一个基础但强大的数据可视化工具。但当我们使用 Jupyter Lab 时,交互特征消失了。jupyter-matplotlib 扩展可以使 Matplotlib 再次具备交互性。只需要输入一个魔术命令 %matplotlib widget 来启动它,则你的精美 3D 图表就变成交互式的。如下动图所示:
图源:https://github.com/matplotlib/ipympl/raw/master/matplotlib.gif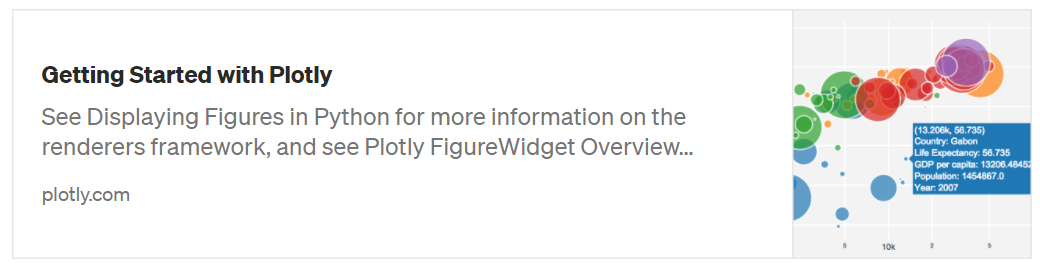
Plotly 使用指南:https://plotly.com/python/getting-started/#jupyterlab-support-python-35虽然 Matplotlib 是最基础和强大的数据可视化库,但在这方面我最喜欢的是 Plotly 库。该库封装了很多常见图表,我们可以通过数行代码生成令人惊叹的图表。为使 Jupyter Lab 无缝支持和显示交互的 Plotly 图表,用户需要安装 jupyterlab-plotly。原文链接:https://towardsdatascience.com/10-jupyter-lab-extensions-to-boost-your-productivity-4b3800b7ca2a近两年里,我原创和翻译了130+技术文章,主要关注Python进阶、小技巧、编程设计、PEP翻译、Python哲学等话题。现已集结出了一本电子书《优雅的Python》,请回复数字『1』,获取下载地址。分享与在看是对我最大的支持!

 下载APP
下载APP