
Pandas+Pyecharts | 某市成交房源信息数据可视化
零基础python入门教程:python666.cn
大家好,欢迎来到 Crossin的编程教室 !
今天给大家分享一个数据分析及可视化的案例:通过分析广州市30000+条已成交房源信息数据,分析一下广州市房价以及房源分布情况:
各区房源成交数量分布 各区房源成交价格分布
成交日期分布规律 等等
涉及到的库:
Pandas — 数据处理
Pyecharts — 数据可视化
可视化部分:
柱状图 — Bar
地图 — Map
饼图 — Pie
树图 — TreeMap
日历图 — Calendar
旭日图 — Sunburst
词云图 — stylecloud
组合组件 — Grid
1. 导入模块
2.Pandas数据处理
2.1 读取数据
2.2 数据大小
2.3 数据去重
2.4 查看索引、数据类型和内存信息
2.5 查看数据列分布信息
2.6 成交日期处理
3. Pyecharts数据可视化
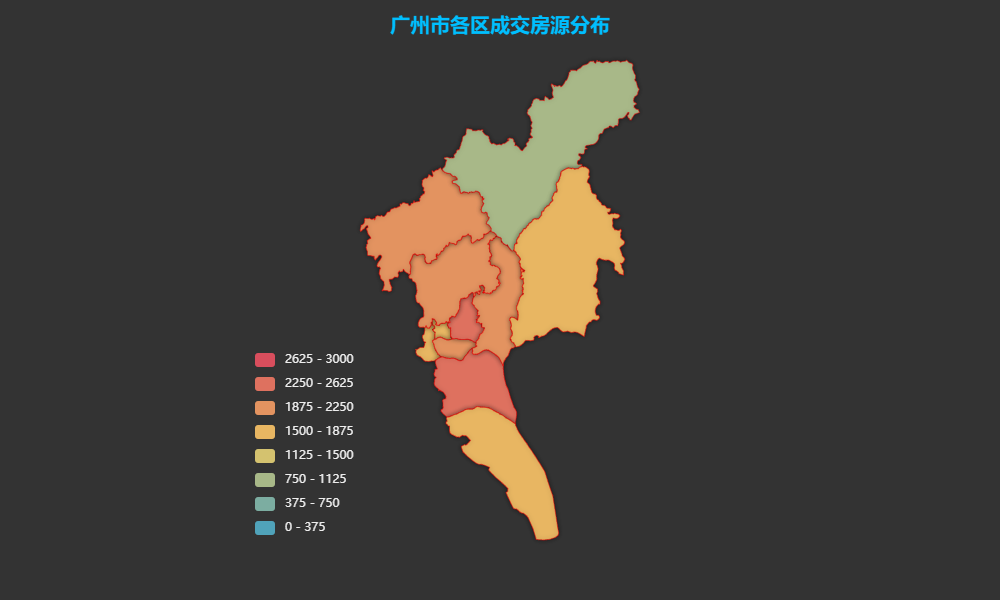
3.1 广州市各区成交房源分布地图
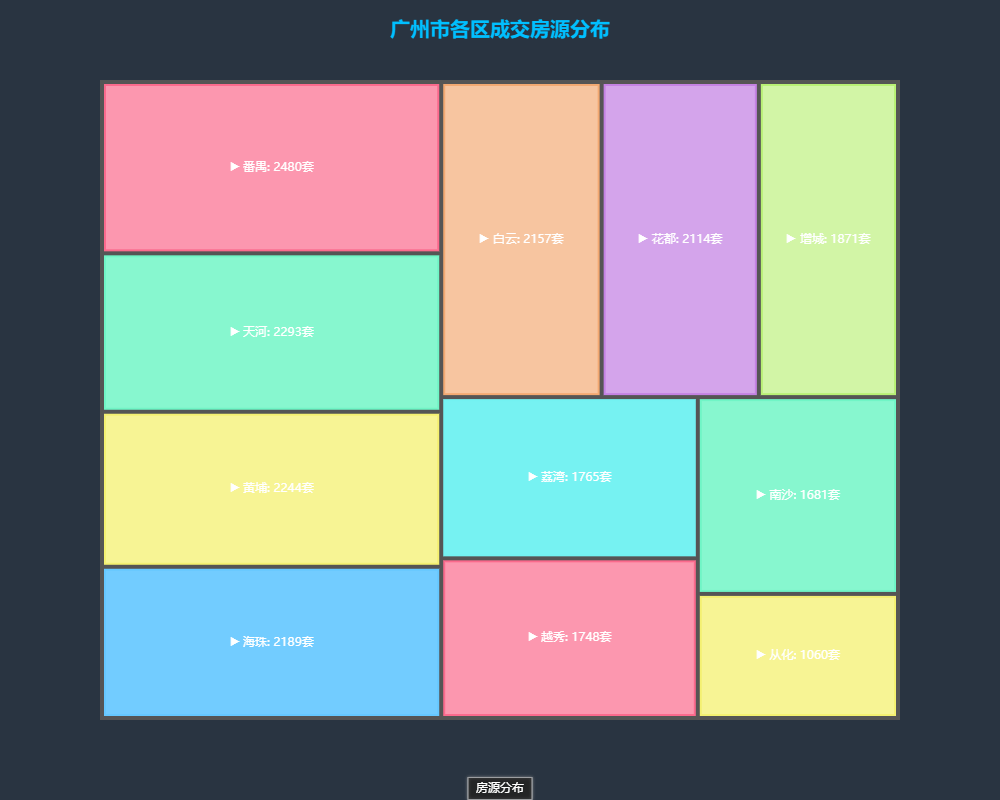
3.2 广州市各区成交房源分布--矩形树图
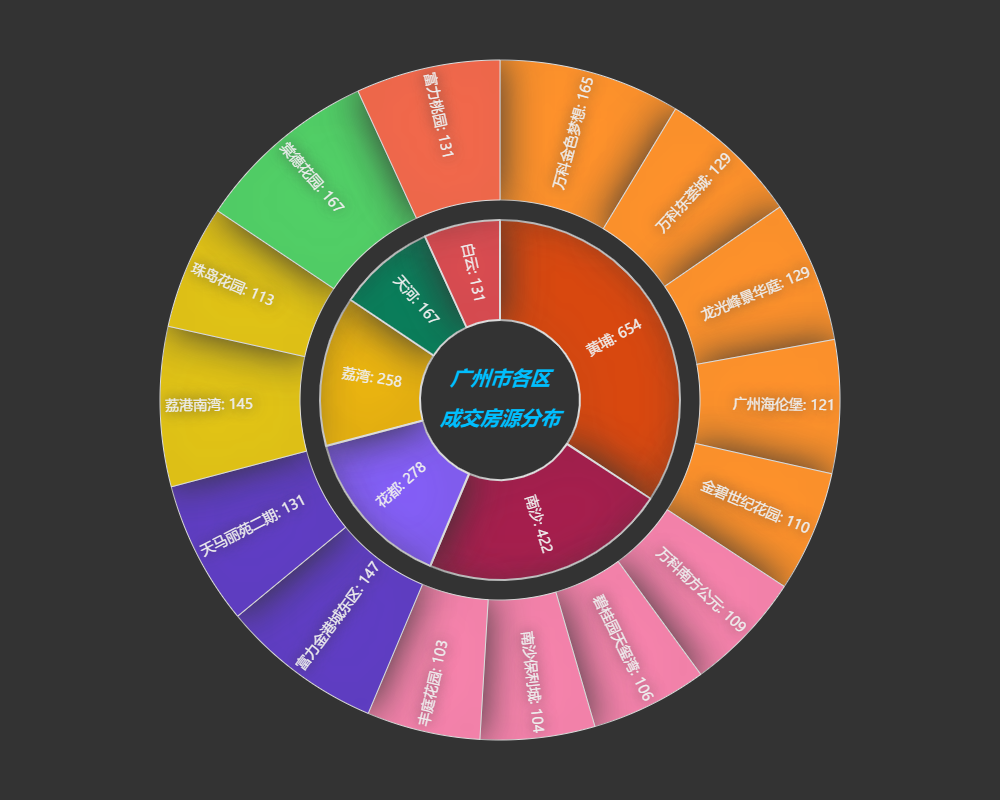
3.3 广州市各区成交房源分布--旭日图
3.4 2020年广州市每日成交房源数量分布--日历图
3.5 广州市成交房源房型和售价分布--扇形图
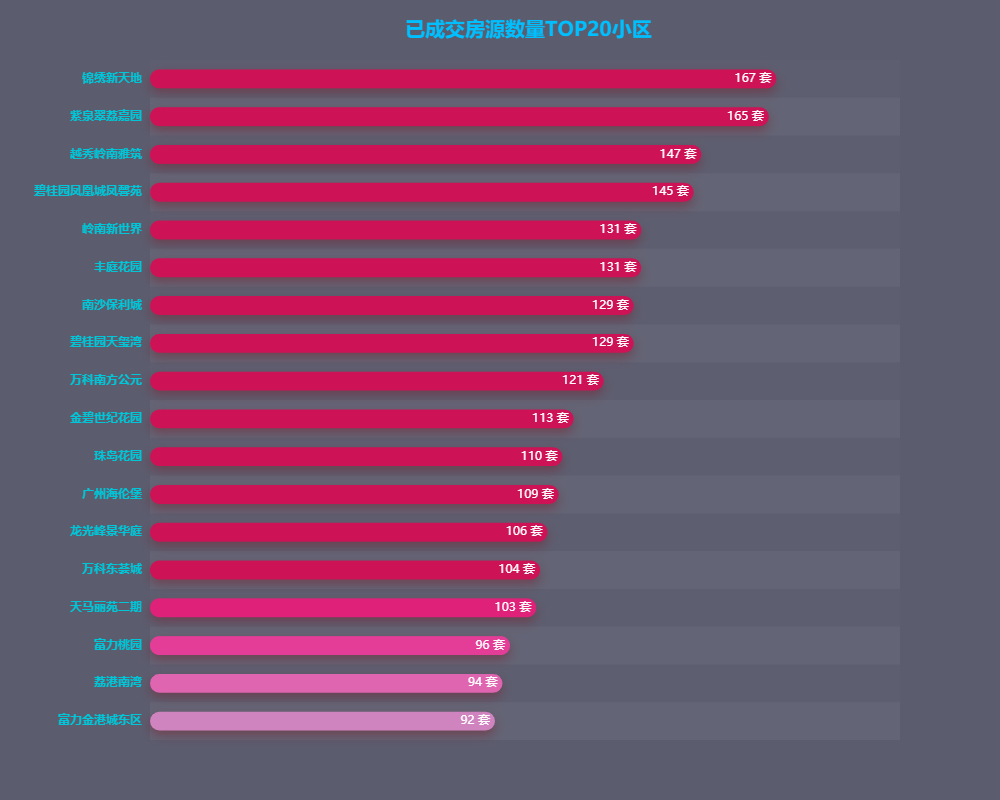
3.6 广州市成交房源数量TOP20小区--柱状图
3.7 小区--词云
4. 项目在线运行地址
可视化部分需要用到 pyecharts==1.9.0,已安装其他低版本的需要升级,如果未安装过pyecharts,直接pip安装就是最新版本。
import datetimeimport stylecloudimport pandas as pdfrom PIL import Imagefrom pyecharts.charts import Map,Bar,Grid,Pie,Page,TreeMap,Sunburst,Calendarfrom pyecharts import options as optsfrom pyecharts.globals import ThemeTypefrom pyecharts.globals import SymbolType
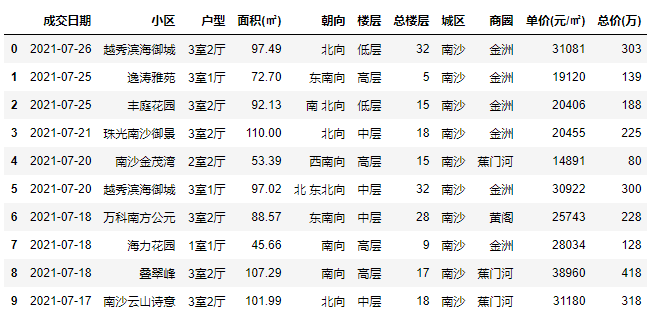
df = pd.read_excel('广州房屋成交信息.xlsx')df.head(10)
结果:
2.2 数据大小
df.shape2.3 数据去重
df.drop_duplicates(subset=['成交日期','小区','户型','面积(㎡)','楼层'],keep='first',inplace=True)df.shape
(21806, 11),一共有: 21806 条非重复数据。
2.4 查看索引、数据类型和内存信息
df.info()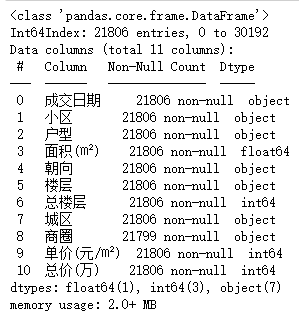
商圈列存在数据缺失,用 “未知” 填充:
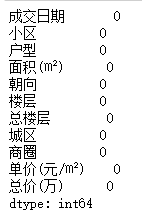
df['商圈'].fillna('未知', inplace=True)df.isnull().sum()
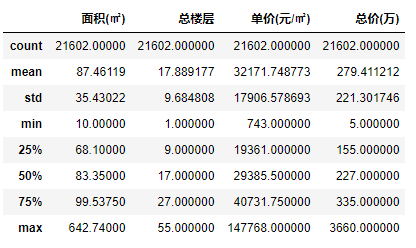
2.5 查看数据列分布信息
df.describe()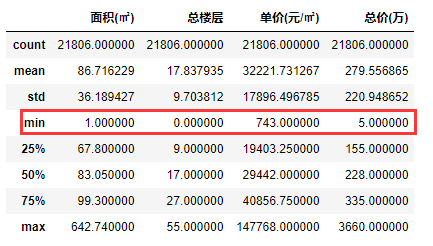
df = df[~((df['面积(㎡)'] < 10) | (df['总楼层'] == 0) | (df['户型'] == '0室0厅'))]df.describe()
2.6 成交日期处理
df['成交日期'] = df.iloc[:,0].apply(lambda x : x[:10])df['成交日期'].unique()
df_region = df.groupby('城区')['小区'].count().to_frame('数量').reset_index()region = df_region['城区'].values.tolist()count = df_region['数量'].values.tolist()new = [x + '区' for x in region]m = (Map(init_opts=opts.InitOpts(theme='dark',width='1000px', height='600px')).add('',[list(z) for z in zip(new, count)],'广州',is_map_symbol_show=False).set_global_opts(title_opts=opts.TitleOpts(title='广州市各区成交房源分布', pos_left='center', pos_top='2%',title_textstyle_opts=opts.TextStyleOpts(color='#00BFFF',font_size=20,font_weight='bold'),),visualmap_opts=opts.VisualMapOpts(max_=3000,split_number=8,is_piecewise=True,pos_bottom='10%',pos_left='25%')))
效果:
3.2 广州市各区成交房源分布--矩形树图
tree = TreeMap(init_opts=opts.InitOpts(theme='chalk', width='1000px', height='800px'))tree.add('房源分布',data,leaf_depth=1,label_opts=opts.LabelOpts(position='inside', formatter='{b}: {c}套'),levels=[opts.TreeMapLevelsOpts(treemap_itemstyle_opts=opts.TreeMapItemStyleOpts(border_color='#555', border_width=4, gap_width=4)),opts.TreeMapLevelsOpts(color_saturation=[0.3, 0.6],treemap_itemstyle_opts=opts.TreeMapItemStyleOpts(border_color_saturation=0.7, gap_width=2, border_width=2),),opts.TreeMapLevelsOpts(color_saturation=[0.3, 0.7],color_mapping_by= 'value',treemap_itemstyle_opts=opts.TreeMapItemStyleOpts(border_color_saturation=0.6, gap_width=1),),],)tree.set_global_opts(title_opts=opts.TitleOpts(title='广州市各区成交房源分布', pos_left='center', pos_top='2%',title_textstyle_opts=opts.TextStyleOpts(color='#00BFFF', font_size=20)),legend_opts=opts.LegendOpts(is_show=False))
效果:
3.3 广州市各区成交房源分布--旭日图
s = (Sunburst(init_opts=opts.InitOpts(theme='dark',width='1000px',height='800px')).add('',data_pair=data_pair,highlight_policy='ancestor',radius=[0, '100%'],sort_='null',levels=[{},{'r0': '20%','r': '45%','itemStyle': {'shadowBlur': 40,'shadowColor':'#333','borderColor': 'rgb(220,220,220)', 'borderWidth': 2}},{'r0': '50%', 'r': '85%', 'label': {'align':'right','textShadowBlur': 15,'textShadowColor': '#333'},'itemStyle': {'shadowBlur': 40,'shadowColor':'#333','borderColor': 'rgb(220,220,220)', 'borderWidth': 1}},],).set_global_opts(title_opts=opts.TitleOpts(title='广州市各区\n\n成交房源分布',pos_left='center',pos_top='center',title_textstyle_opts=opts.TextStyleOpts(font_style='oblique', font_size=20,color='#00BFFF'),)).set_series_opts(label_opts=opts.LabelOpts(font_size=14, formatter='{b}: {c}')))
效果:
3.4 2020年广州市每日成交房源数量分布--日历图
c = (Calendar(init_opts=opts.InitOpts(width='800px', height='500px')).add('',data_c,calendar_opts=opts.CalendarOpts(pos_top='18%',pos_left='15%',range_='2020',daylabel_opts=opts.CalendarDayLabelOpts(name_map='cn',margin=10,label_font_size=12,label_color='#df65b0',),monthlabel_opts=opts.CalendarMonthLabelOpts(name_map='cn',margin=10,label_font_size=12,label_color='#df65b0',is_show=True)),).set_global_opts(title_opts=opts.TitleOpts(title='2020年广州市每日成交房源数量分布',pos_left='40%',pos_top='5%',title_textstyle_opts=opts.TextStyleOpts(font_size=16,color='#00BFFF',font_weight='bold')),visualmap_opts=opts.VisualMapOpts(max_=150,orient='horizontal',pos_top='52%',pos_left='30%',is_piecewise=True,),legend_opts=opts.LegendOpts(is_show=False),))
效果:
可以看到每年的6月至11月是房屋成交的高发期,尤其是11月份
由于工作的原因,周六、周日是最频繁的成交日期,其次是周一
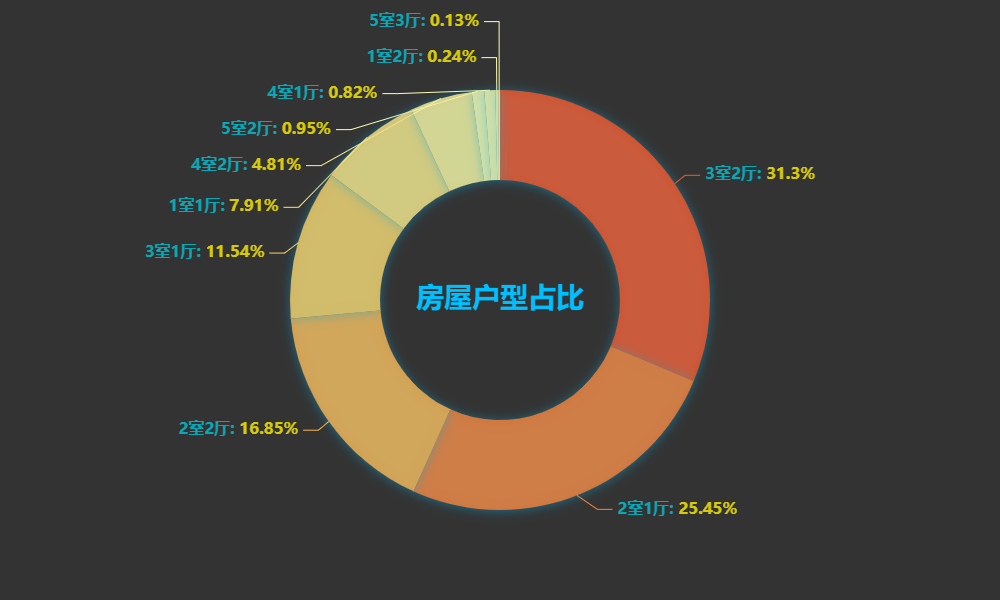
3.5 广州市成交房源房型和售价分布--扇形图
p2 = (Pie(init_opts=opts.InitOpts(theme=ThemeType.DARK,width='1000px',height='600px')).add('户型', p_data, radius=['40%', '70%']).set_series_opts(label_opts=opts.LabelOpts(formatter="\n{b|{b}: }{d|{d}%}\n",rich={"b": {"color": "#00c6d7","fontSize": 16, "lineHeight": 33, "fontWeight":700},"d": {"color": "#fff000","fontSize": 16, "lineHeight": 33, "fontWeight":900},},),).set_global_opts(title_opts=opts.TitleOpts(title='房屋户型占比',pos_left='center',pos_top='center',title_textstyle_opts=opts.TextStyleOpts(color='#00BFFF',font_size=28,font_weight='bold'),),visualmap_opts=opts.VisualMapOpts(is_show=False,min_=300,max_=10000,is_piecewise=False,dimension=0,range_color=['#ffffb2','#fecc5c','#fd8d3c','#f03b20','#bd0026']),legend_opts=opts.LegendOpts(is_show=False, pos_top='5%'),))
各房型占比:
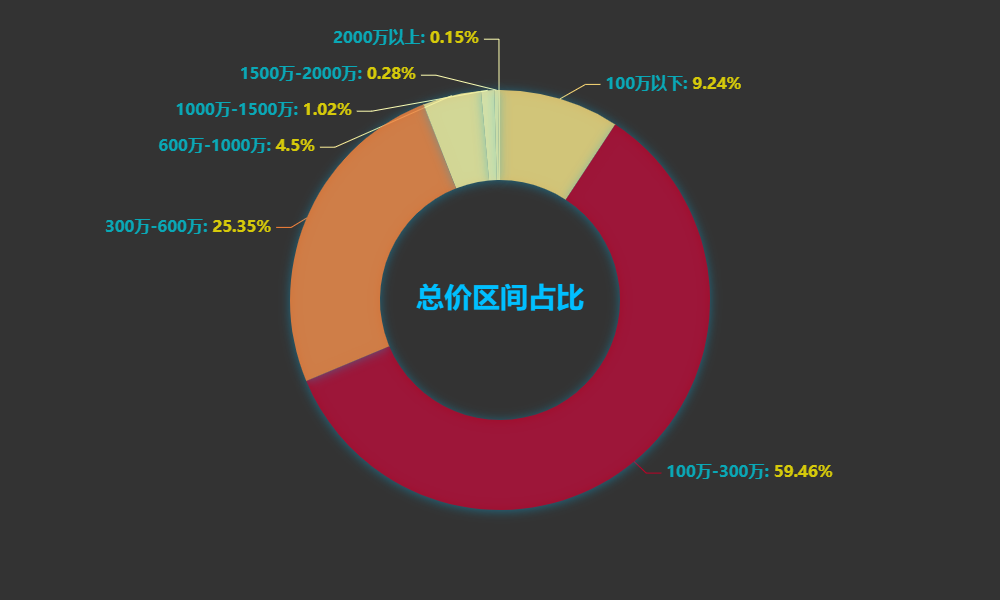
房屋总价方面:100万以下房屋占比9%,100-300万的价格占比接近60%,600万以下占比达到95%左右
房屋户型方面:2居室占比45%左右,3居室占比达到42%
效果:
3.7 小区--词云
stylecloud.gen_stylecloud(text=' '.join(df['小区'].values.tolist()),font_path=r'STXINWEI.TTF',palette='cartocolors.qualitative.Bold_5',max_font_size=100,icon_name='fas fa-home',background_color='#212529')
效果:

作者:欧King
_往期文章推荐_