基于 Prometheus、InfluxDB 与 Grafana 打造监控平台


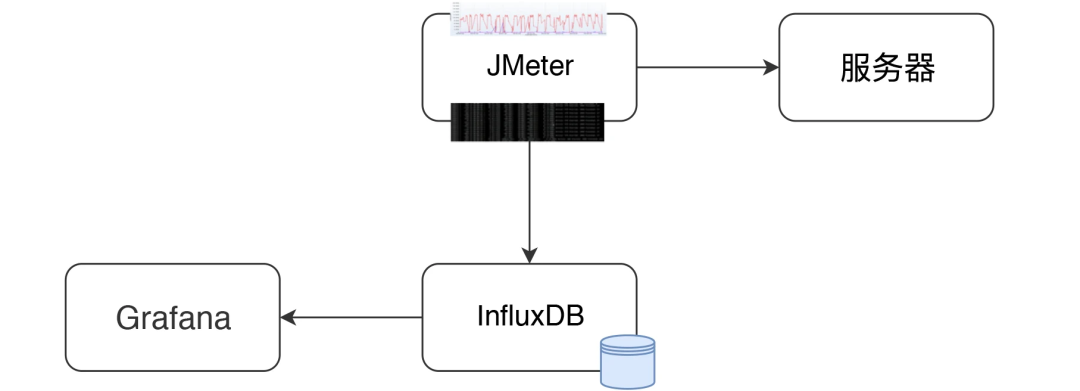
JMeter + InfluxDB + Grafana 的数据展示逻辑

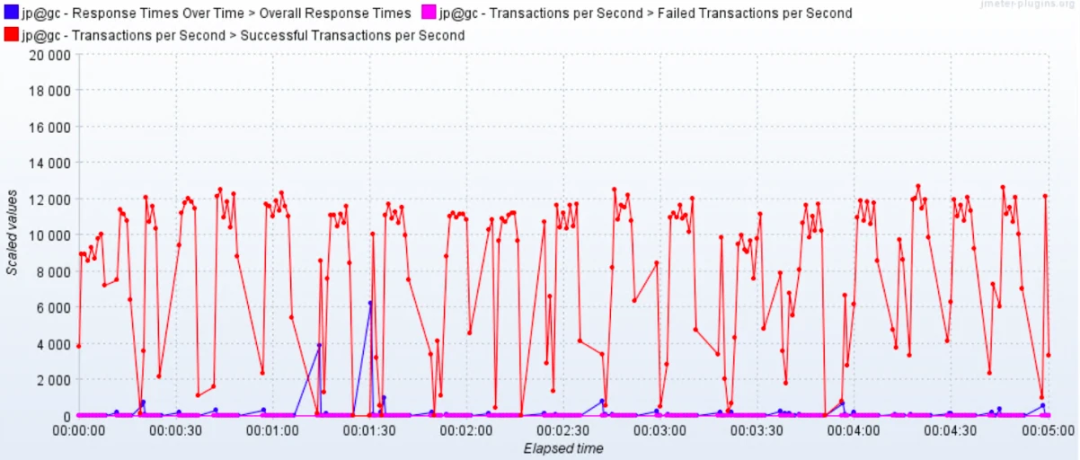
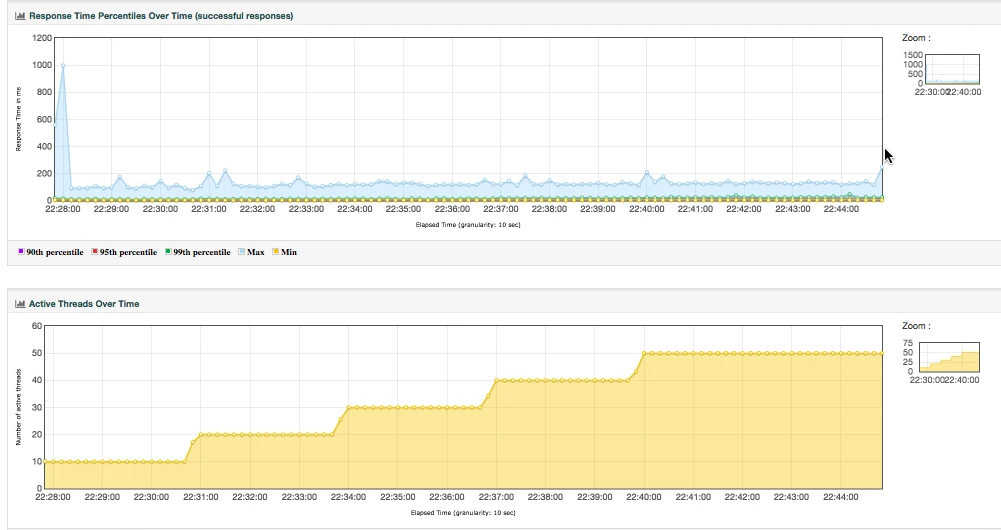
整理结果时比较浪费时间。
在 GUI 用插件看曲线,做高并发时并不现实。
在场景运行时间比较长的时候,采用生成 HTML 的方式,会出现消耗内存过大的情况,而实际上,在生成的结果图中,有很多生成的图我们并不是那么关注。
生成的结果保存之后再查看比较麻烦,还要一个个去找。
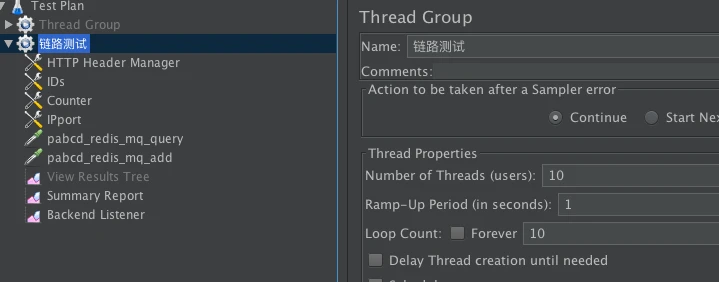
JMeter 中 Backend Listener 的配置

private void addMetrics(String transaction, SamplerMetric metric) {
        // FOR ALL STATUS
        addMetric(transaction, metric.getTotal(), metric.getSentBytes(), metric.getReceivedBytes(), TAG_ALL, metric.getAllMean(), metric.getAllMinTime(),
                metric.getAllMaxTime(), allPercentiles.values(), metric::getAllPercentile);
        // FOR OK STATUS
        addMetric(transaction, metric.getSuccesses(), null, null, TAG_OK, metric.getOkMean(), metric.getOkMinTime(),
                metric.getOkMaxTime(), okPercentiles.values(), metric::getOkPercentile);
        // FOR KO STATUS
        addMetric(transaction, metric.getFailures(), null, null, TAG_KO, metric.getKoMean(), metric.getKoMinTime(),
                metric.getKoMaxTime(), koPercentiles.values(), metric::getKoPercentile);


        metric.getErrors().forEach((error, count) -> addErrorMetric(transaction, error.getResponseCode(),
                    error.getResponseMessage(), count));
    }
@Override public void writeAndSendMetrics() {
 ........ if (!copyMetrics.isEmpty()) { try { if(httpRequest == null) {
                    httpRequest = createRequest(url);
                }
                StringBuilder sb = new StringBuilder(copyMetrics.size()*35); for (MetricTuple metric : copyMetrics) { // Add TimeStamp in nanosecond from epoch ( default in InfluxDB )
 sb.append(metric.measurement)
                        .append(metric.tag)
                        .append(" ") //$NON-NLS-1$
 .append(metric.field)
                        .append(" ")
                        .append(metric.timestamp+"000000")
                        .append("\n"); //$NON-NLS-1$
 }


                StringEntity entity = new StringEntity(sb.toString(), StandardCharsets.UTF_8);

                httpRequest.setEntity(entity);
                lastRequest = httpClient.execute(httpRequest, new FutureCallback() {
                    @Override public void completed(final HttpResponse response) { int code = response.getStatusLine().getStatusCode(); /* * HTTP response summary 2xx: If your write request received
                         * HTTP 204 No Content, it was a success! 4xx: InfluxDB
                         * could not understand the request. 5xx: The system is
                         * overloaded or significantly impaired. */
                        if (MetricUtils.isSuccessCode(code)) { if(log.isDebugEnabled()) {
                                log.debug("Success, number of metrics written: {}", copyMetrics.size());
                            }
                        } else {
                            log.error("Error writing metrics to influxDB Url: {}, responseCode: {}, responseBody: {}", url, code, getBody(response));
                        }
                    }
                    @Override public void failed(final Exception ex) {
                        log.error("failed to send data to influxDB server : {}", ex.getMessage());
                    }
                    @Override public void cancelled() {
                        log.warn("Request to influxDB server was cancelled");
                    }
                });
 ........
            }
        }
    }
InfluxDB 中的存储结构
> show databases
name: databases
name
----
_internal
jmeter
> use jmeter
Using database jmeter
>
> show MEASUREMENTS
name: measurements
name
----
events
jmeter
> select * from events where application='7ddemo'
name: events
time application text title
---- ----------- ---- -----
1575255462806000000 7ddemo Test Cycle1 started ApacheJMeter
1575256463820000000 7ddemo Test Cycle1 ended ApacheJMeter
..............
n> select * from jmeter where application='7ddemo' limit 10
name: jmeter
time application avg count countError endedT hit max maxAT meanAT min minAT pct90.0 pct95.0 pct99.0 rb responseCode responseMessage sb startedT statut transaction
---- ----------- --- ----- ---------- ------ --- --- ----- ------ --- ----- ------- ------- ------- -- ------------ --------------- -- -------- ------ -----------
1575255462821000000 7ddemo 0 0 0 0 0 internal
1575255467818000000 7ddemo 232.82352941176472 17 0 17 849 122 384.9999999999996 849 849 0 0 all all
1575255467824000000 7ddemo 232.82352941176472 17 849 122 384.9999999999996 849 849 0 0 all 0_openIndexPage
1575255467826000000 7ddemo 232.82352941176472 17 849 122 384.9999999999996 849 849 ok 0_openIndexPage
1575255467829000000 7ddemo 0 1 1 1 1 internal
1575255472811000000 7ddemo 205.4418604651163 26 0 26 849 122 252.6 271.4 849 0 0 all all
1575255472812000000 7ddemo 0 1 1 1 1 internal
1575255472812000000 7ddemo 205.4418604651163 26 849 122 252.6 271.4 849 ok 0_openIndexPage
1575255472812000000 7ddemo 205.4418604651163 26 849 122 252.6 271.4 849 0 0 all 0_openIndexPage
1575255477811000000 7ddemo 198.2142857142857 27 0 27 849 117 263.79999999999995 292.3500000000001 849 0 0 all all
Grafana 中的配置
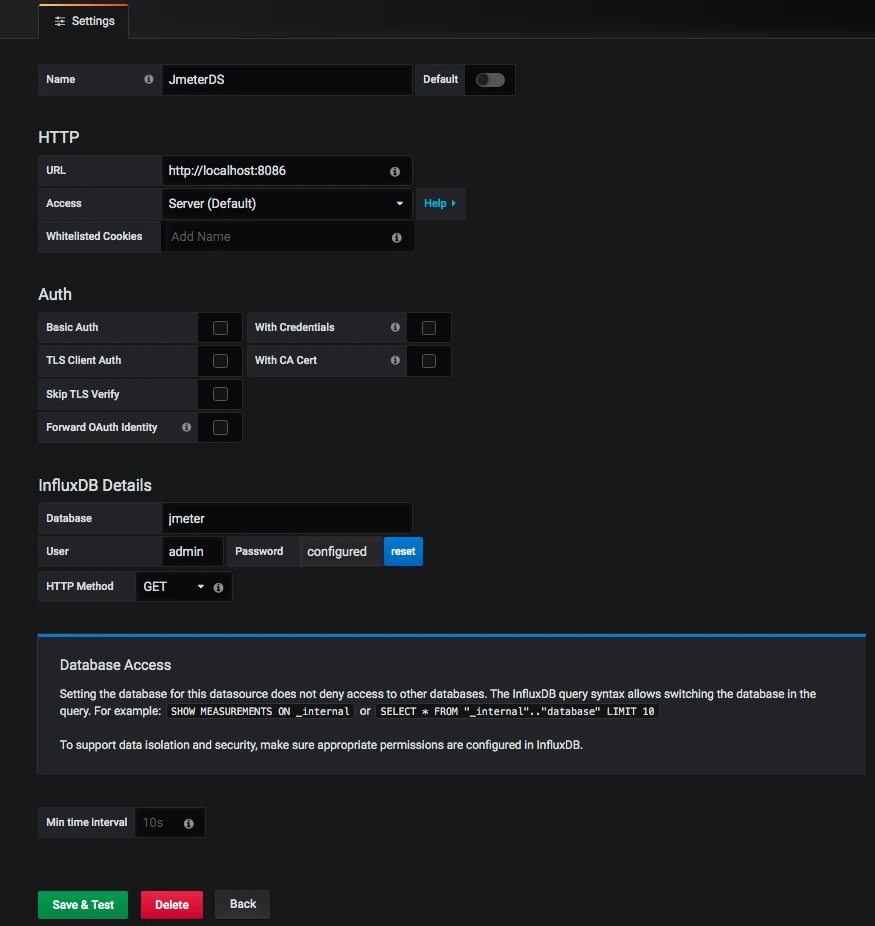
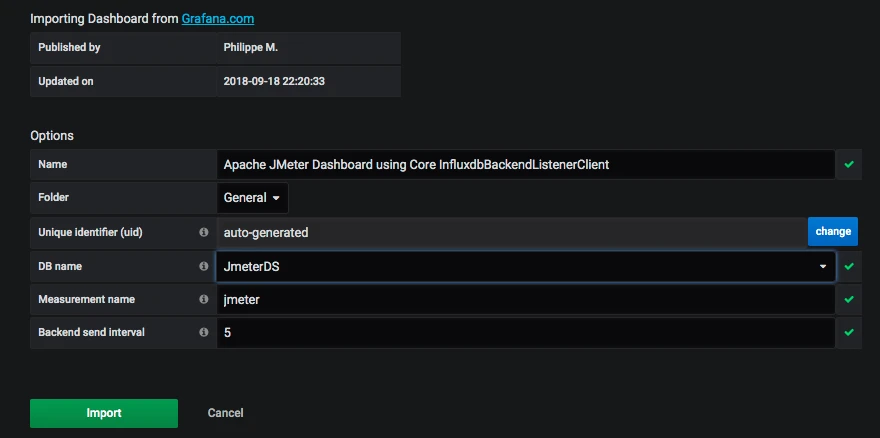
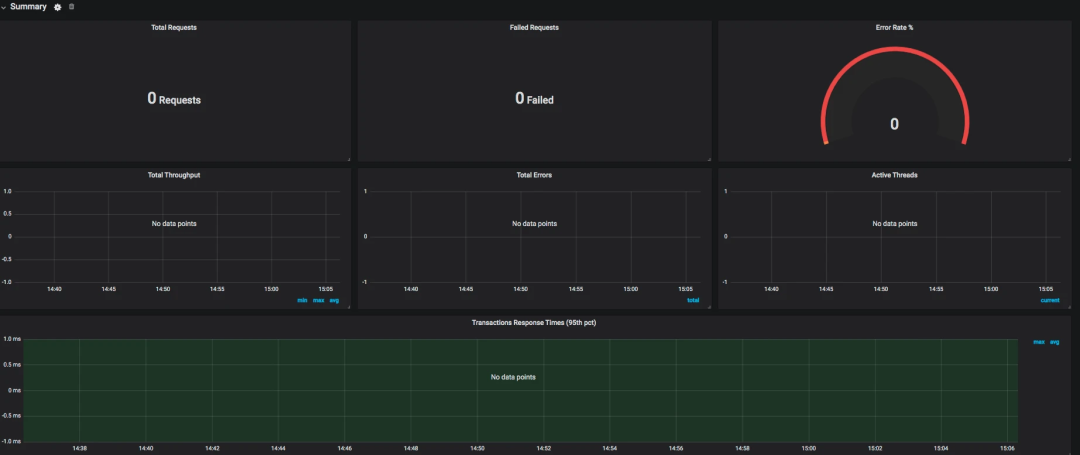
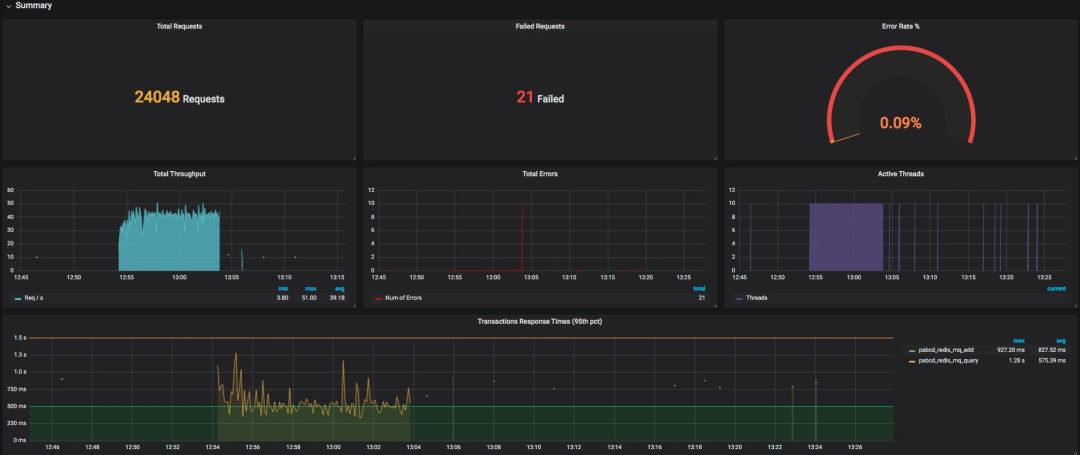
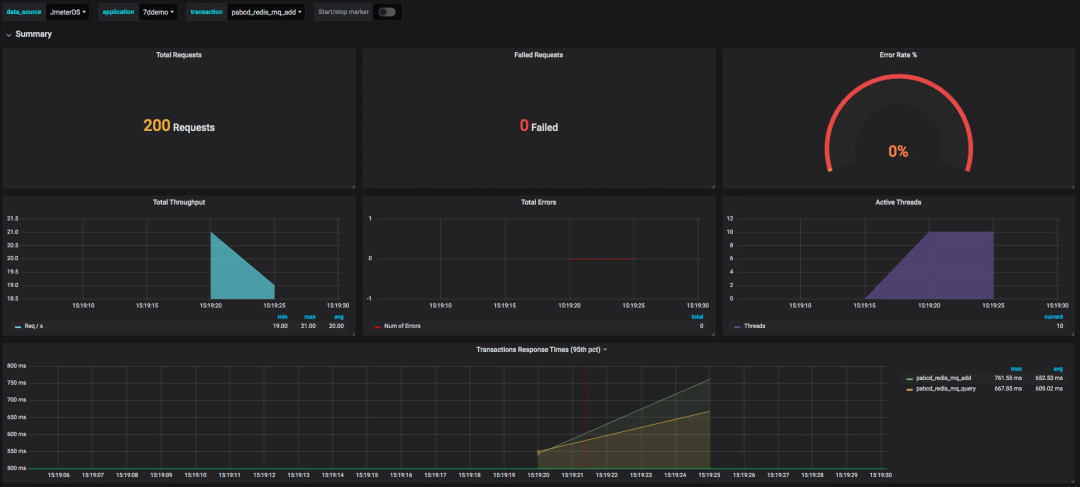
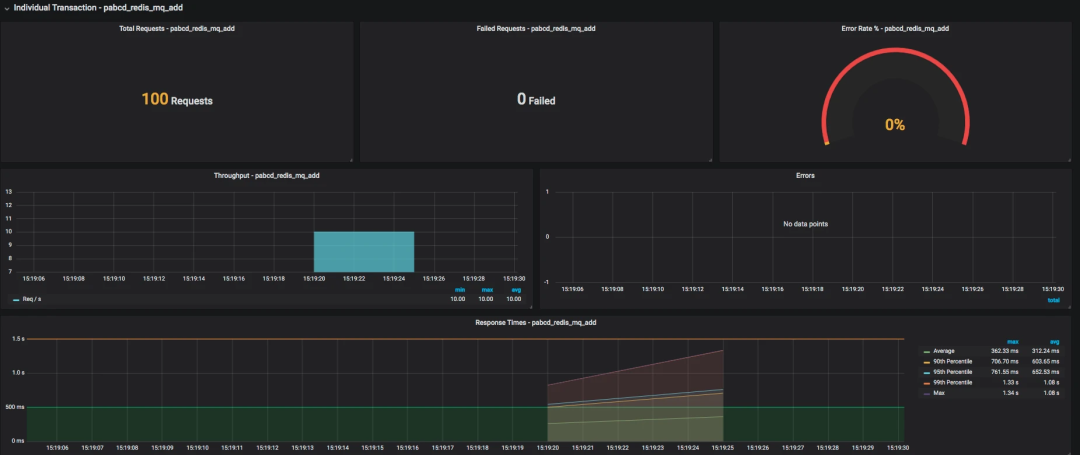
SELECT last("count") / $send_interval FROM "$measurement_name" WHERE ("transaction" =~ /^$transaction$/ AND "statut" = 'ok') AND $timeFilter GROUP BY time($__interval)
SELECT mean("pct95.0") FROM "$measurement_name" WHERE ("application" =~ /^$application$/) AND $timeFilter GROUP BY "transaction", time($__interval) fill(null)

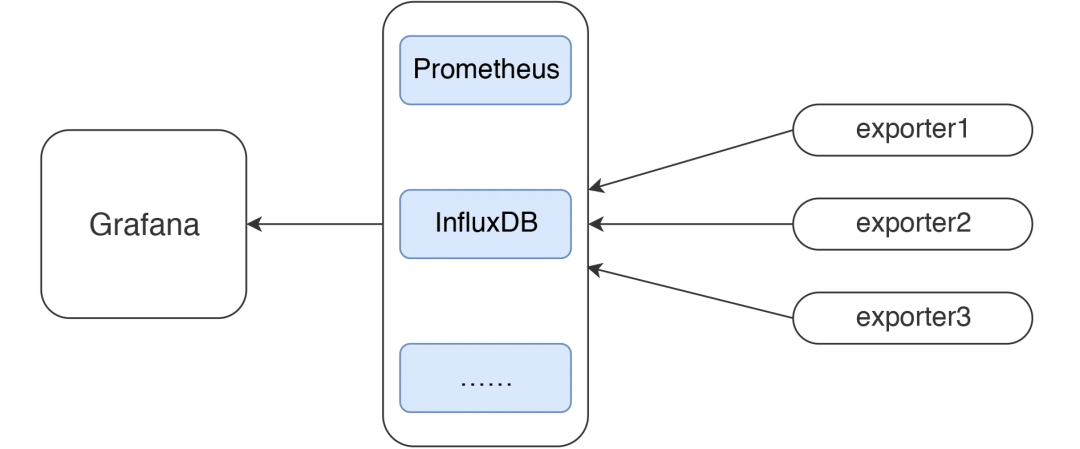
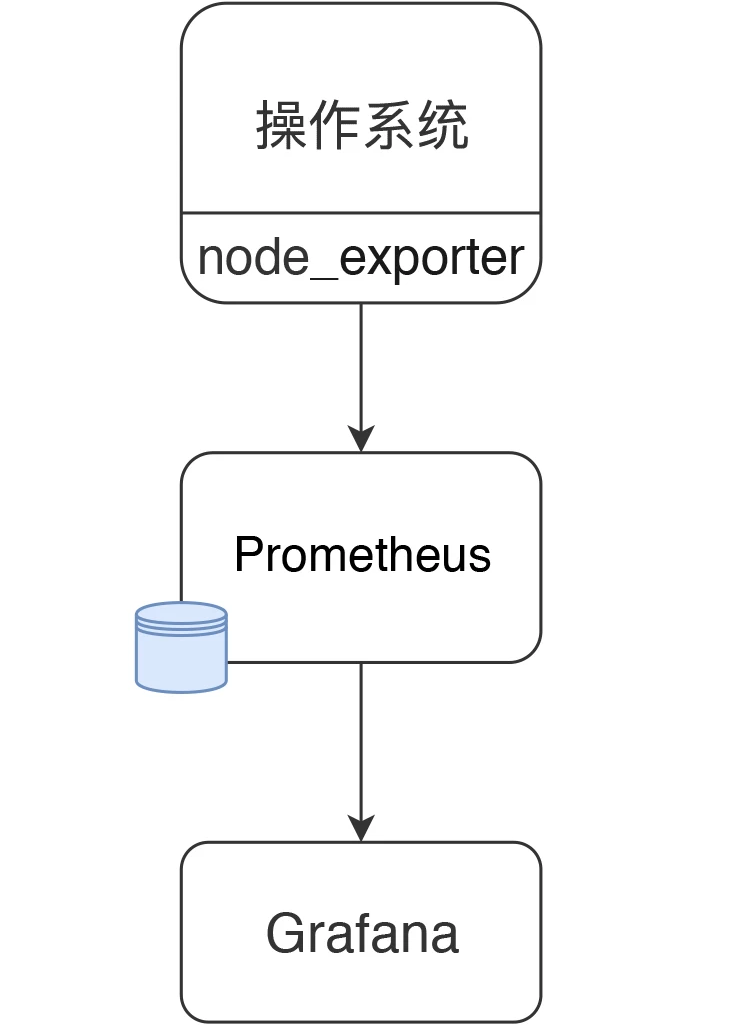
node_exporter + Prometheus + Grafana 的数据展示逻辑
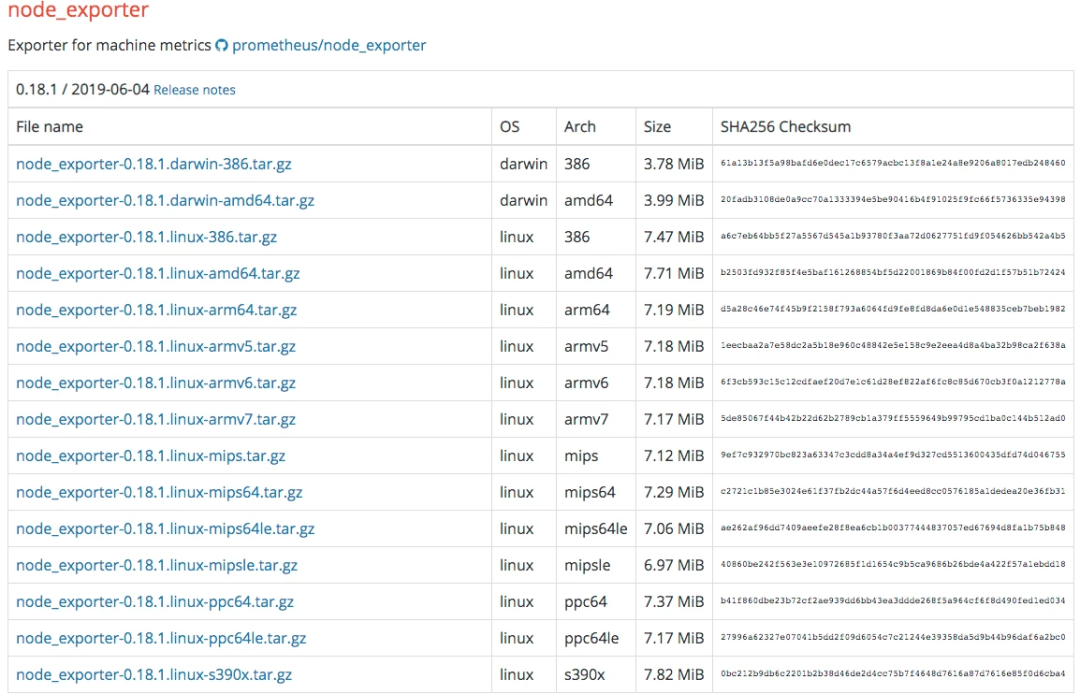
[root@7dgroup2 node_exporter-0.18.1.linux-amd64]# ll
total 16524
-rw-r--r-- 1 3434 3434 11357 Jun 5 00:50 LICENSE
-rwxr-xr-x 1 3434 3434 16878582 Jun 5 00:41 node_exporter
-rw-r--r-- 1 3434 3434 463 Jun 5 00:50 NOTICE}
[root@7dgroup2 node_exporter-0.18.1.linux-amd64]#./node_exporter --web.listen-address=:9200 &
[root@7dgroup2 data]# wget -c https://github.com/prometheus/prometheus/releases/download/v2.14.0/prometheus-2.14.0.linux-amd64.tar.gz
..........
100%[=============================================================================================>] 58,625,125 465KB/s in 6m 4s


2019-11-29 15:40:16 (157 KB/s) - ‘prometheus-2.14.0.linux-amd64.tar.gz’ saved [58625125/58625125]


[root@7dgroup2 data]
[root@7dgroup2 prometheus-2.11.1.linux-amd64]# ll
total 120288
drwxr-xr-x. 2 3434 3434 4096 Jul 10 23:26 console_libraries
drwxr-xr-x. 2 3434 3434 4096 Jul 10 23:26 consoles
drwxr-xr-x. 3 root root 4096 Nov 30 12:55 data
-rw-r--r--. 1 3434 3434 11357 Jul 10 23:26 LICENSE
-rw-r--r--. 1 root root 35 Aug 7 23:19 node.yml
-rw-r--r--. 1 3434 3434 2770 Jul 10 23:26 NOTICE
-rwxr-xr-x. 1 3434 3434 76328852 Jul 10 21:53 prometheus
-rw-r--r-- 1 3434 3434 1864 Sep 21 09:36 prometheus.yml
-rwxr-xr-x. 1 3434 3434 46672881 Jul 10 21:54 promtool
[root@7dgroup2 prometheus-2.11.1.linux-amd64]#
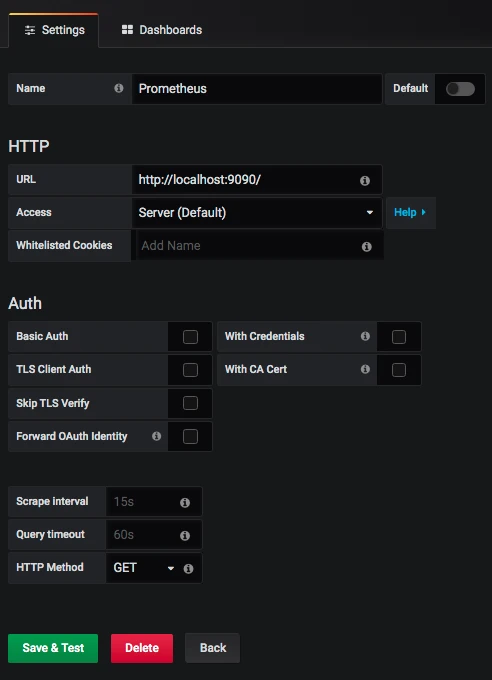
- job_name: 's1'
static_configs:
- targets: ['172.17.211.143:9200']
[root@7dgroup2 data]# ./prometheus --config.file=prometheus.yml &
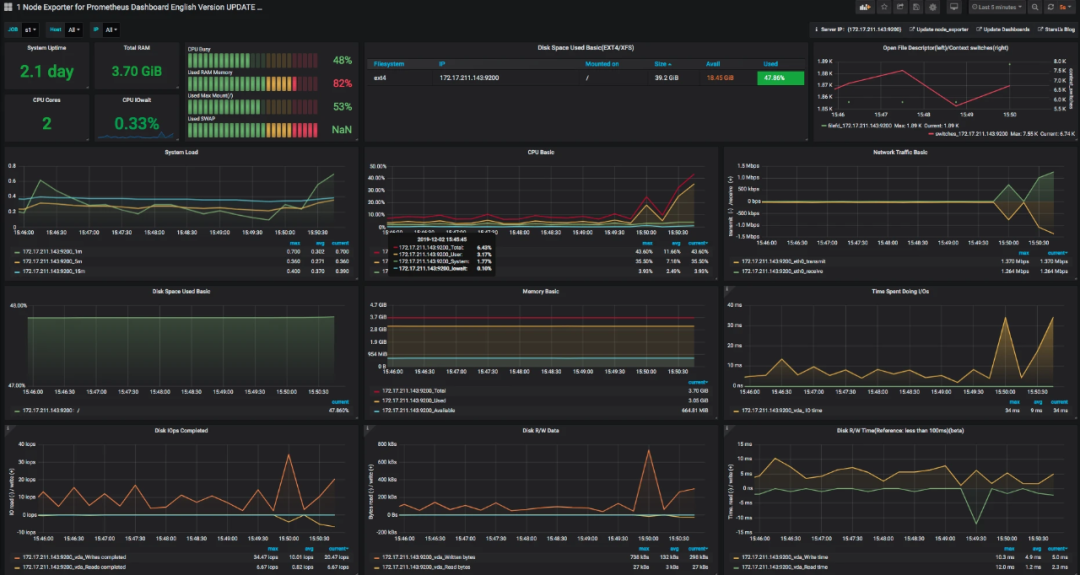
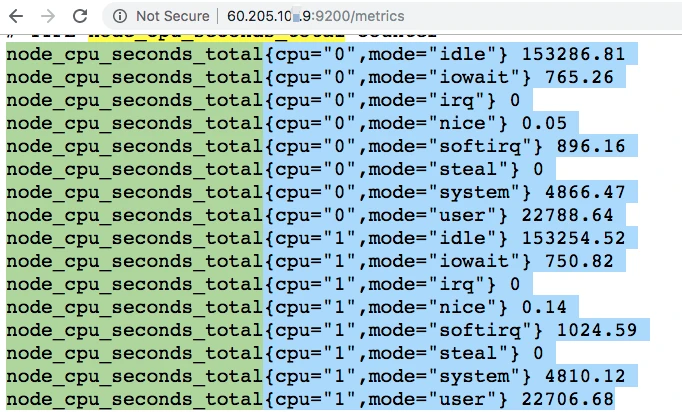
avg(irate(node_cpu_seconds_total{instance=~"$node",mode="system"}[30m])) by (instance) avg(irate(node_cpu_seconds_total{instance=~"$node",mode="user"}[30m])) by (instance) avg(irate(node_cpu_seconds_total{instance=~"$node",mode="iowait"}[30m])) by (instance) 1 - avg(irate(node_cpu_seconds_total{instance=~"$node",mode="idle"}[30m])) by (instance)
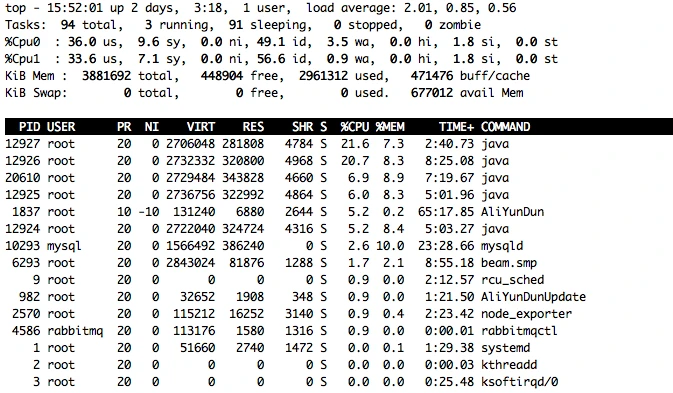
总结
为什么要解释数据的逻辑呢?因为最近在工作中遇到一些情况,有人觉得有了 Prometheus + Grafana + Exportor 这样的组合工具之后,基本上都不再用手工执行什么命令了。但我们要了解的是,对于监控平台来说,它取的所有的数据必然是被监控者可以提供的数据,像 node_exporter 这样小巧的监控收集器,它可以获取的监控数据,并不是整个系统全部的性能数据,只是取到了常见的计数器而已。这些计数器不管是用命令查看,还是用这样炫酷的工具查看,它的值本身都不会变。所以不管是在监控平台上看到的数据,还是在命令行中看到的数据,我们最重要的是要知道含义以及这些值的变化对性能测试和分析的下一步骤的影响。
文章转载:分布式实验室
(版权归原作者所有,侵删)
![]()

点击下方“阅读原文”查看更多
