牛批了,1 行 Python 代码就可实现炫酷可视化

之前画图一直在用 matlibplot、pyecharts,最近学习了一个新的可视化库--cufflinks,用了两天我已经深深爱上它了
主要是因为它用法简单、图形漂亮、代码量少,用一两行代码,就能画出非常漂亮的图形
下面我们一起来看看吧!
1.用法简单
cufflinks库主要和dataFrame数据结合使用,绘图函数就是 dataFrame.iplot,记住这个就行了,但是 iplot 函数里的参数很多,一些参数说明如下:
kind:图的种类,如 scatter、pie、histogram 等mode:lines、markers、lines+markers,分别表示折线、点、折线和点colors:轨迹对应的颜色dash:轨迹对应的虚实线,solid、dash、dashdot 三种width:轨迹的粗细xTitle:横坐标名称yTitle:纵坐标的名称title:图表的标题
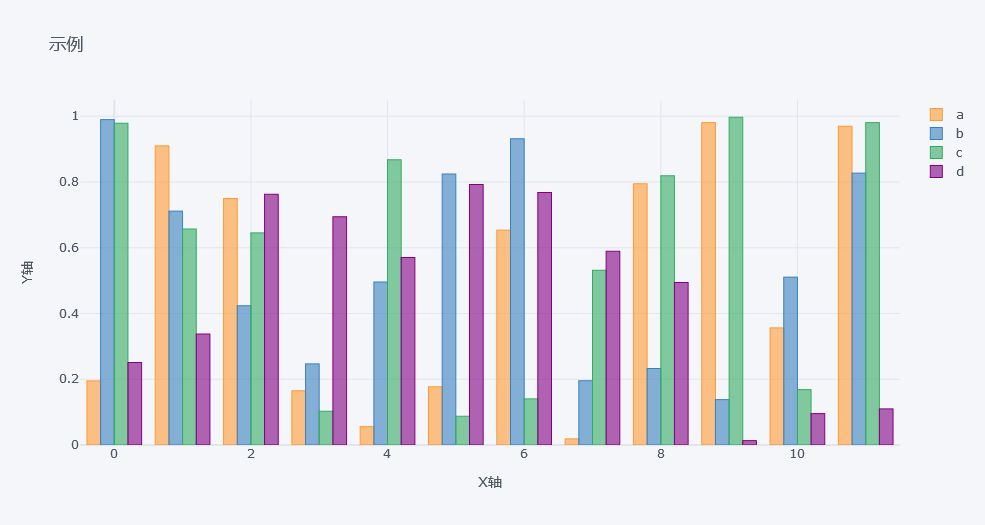
如下图,df为随机生成的dataFrame数据,kind='bar'表示柱状图,title代表标题,xTitle命名X轴,yTitle命名Y轴:
import pandas as pd
import numpy as np
import cufflinks as cf
df=pd.DataFrame(np.random.rand(12, 4), columns=['a', 'b', 'c', 'd'])
df.iplot(kind ='bar',title='示例', xTitle = 'X轴', yTitle ='Y轴')
2.少量代码就能画出非常漂亮的图形
cufflinks为我们提供了丰富的主题样式,支持包括polar、pearl、henanigans、solar、ggplot、space和white等7种主题。
折线图
cf.datagen.lines(4,10).iplot(mode='lines+markers',theme='solar')
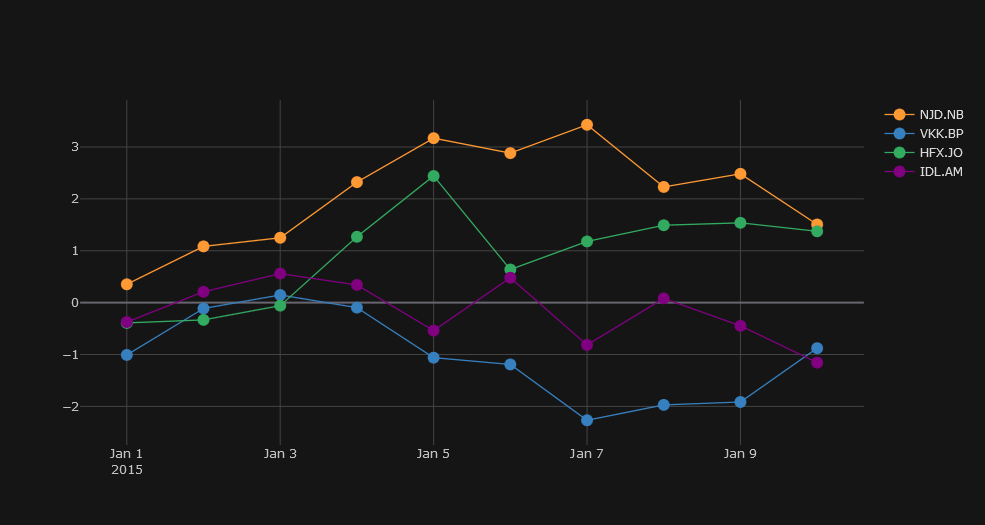
cufflinks使用datagen生成随机数,figure定义为lines形式,cf.datagen.lines(2,10)的具体形式如下:
cf.datagen.lines(2,10) #2代表2组,10代表10天
| WCB.EH | OAA.CQ | |
|---|---|---|
| 2015-01-01 | -0.052580 | -0.351618 |
| 2015-01-02 | 1.056254 | -1.476417 |
| 2015-01-03 | 0.078017 | 1.129168 |
| 2015-01-04 | 0.282141 | 0.908655 |
| 2015-01-05 | 0.960537 | -0.223996 |
| 2015-01-06 | 1.420355 | 0.212851 |
| 2015-01-07 | 2.266144 | 0.358502 |
| 2015-01-08 | 0.008034 | 1.086130 |
| 2015-01-09 | 1.876946 | 2.226895 |
| 2015-01-10 | 1.855625 | 2.852383 |
散点图
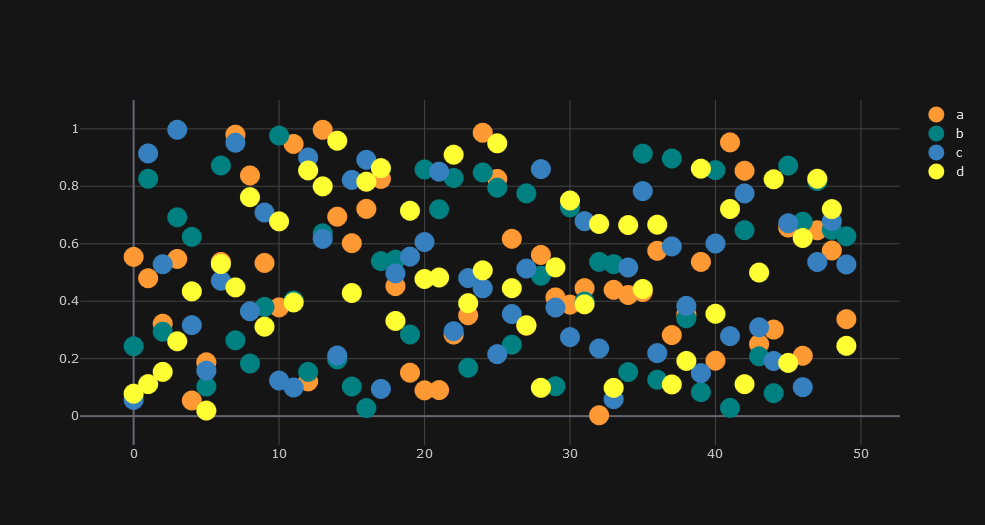
df = pd.DataFrame(np.random.rand(50, 4), columns=['a', 'b', 'c', 'd'])
df.iplot(kind='scatter',mode='markers',colors=['orange','teal','blue','yellow'],size=20,theme='solar')
气泡图
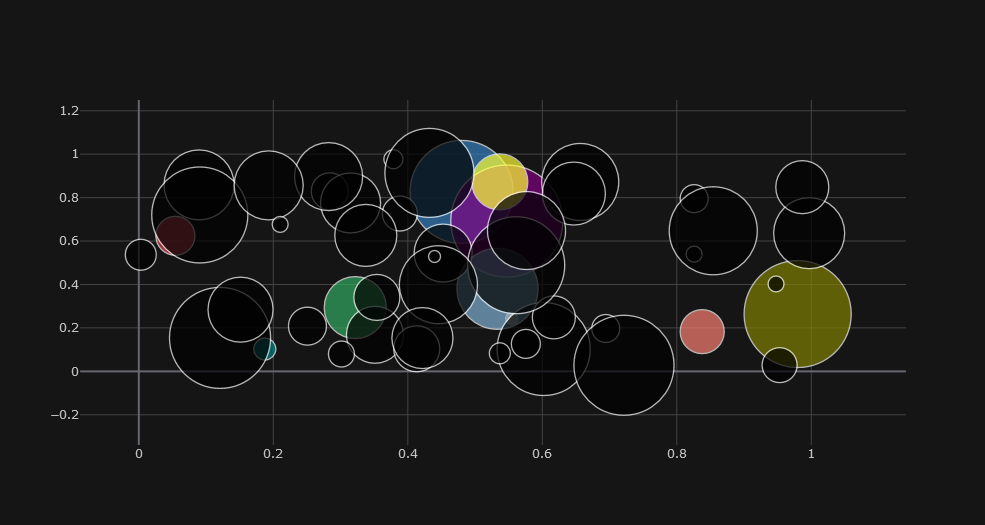
df.iplot(kind='bubble',x='a',y='b',size='c',theme='solar')
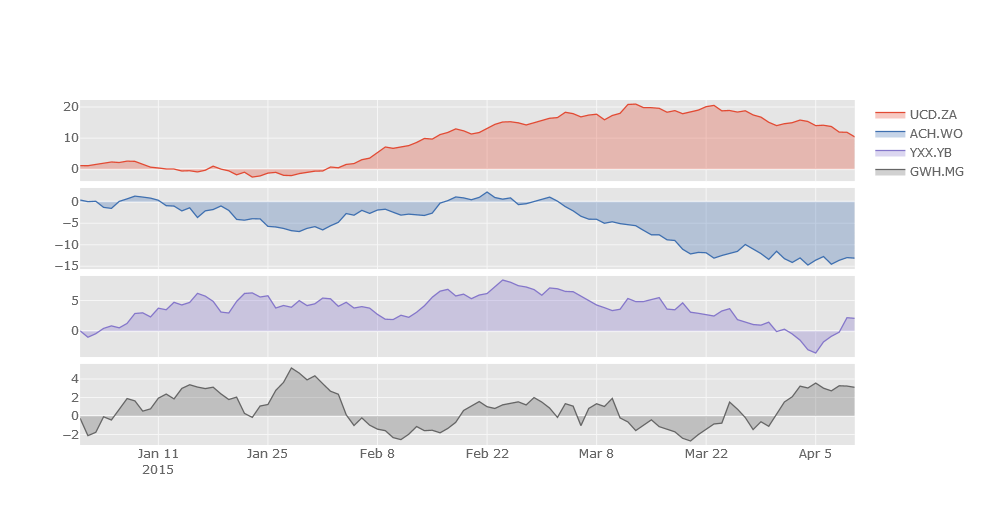
subplots 子图
df=cf.datagen.lines(4)
df.iplot(subplots=True,shape=(4,1),shared_xaxes=True,vertical_spacing=.02,fill=True,theme='ggplot')
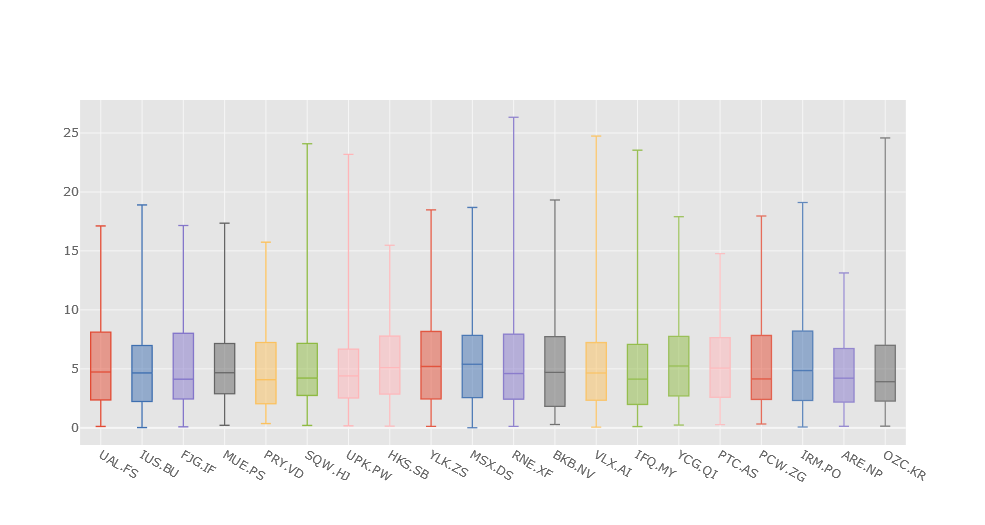
箱形图
cf.datagen.box(20).iplot(kind='box',legend=False,theme='ggplot')
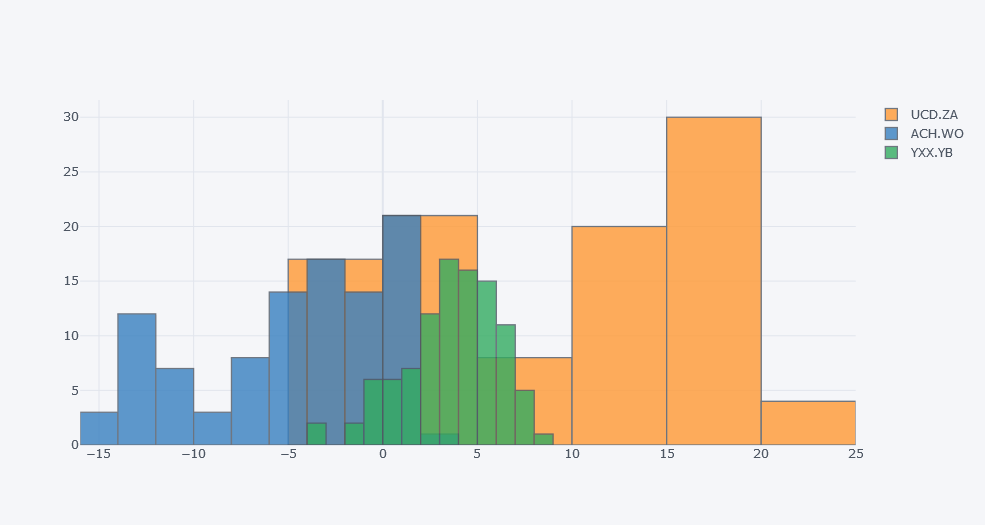
直方图
df.iloc[:,0:3].iplot(kind='histogram')
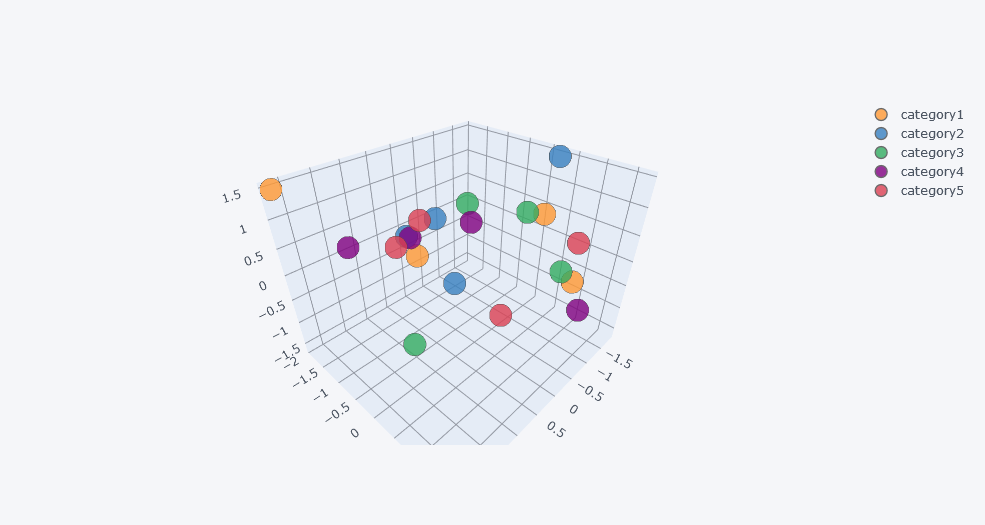
3D图
cf.datagen.scatter3d(5,4).iplot(kind='scatter3d',x='x',y='y',z='z',text='text',categories='categories')
怎么样?是不是很方便,希望我的介绍能够起到抛砖引玉的作用,cufflinks库还有更丰富的绘图功能等着你去挖掘。
评论
