如何使用Python预测机票价格
↑ 关注 + 星标 ,每天学Python新技能
后台回复【大礼包】送你Python自学大礼包
印度的机票价格基于供需关系浮动,很少受到监管机构的限制。因此它通常被认为是不可预测的,而动态定价机制更增添了人们的困惑。
我们的目的是建立一个机器学习模型,根据历史数据预测未来航班的价格,这些航班价格可以给客户或航空公司服务提供商作为参考价格。

1.准备
开始之前,你要确保Python和pip已经成功安装在电脑上,如果没有,请访问这篇文章:超详细Python安装指南 进行安装。
如果你用Python的目的是数据分析,可以直接安装Anaconda:Python数据分析与挖掘好帮手—Anaconda,它内置了Python和pip.
此外,推荐大家用VSCode编辑器,它有许多许多的优点:Python 编程的最好搭档—VSCode 详细指南。
输入命令安装依赖:
1. Windows 环境 打开 Cmd (开始-运行-CMD)
2. MacOS 环境 打开 Terminal (command+空格输入Terminal)
3. 如果你用的是 VSCode编辑器 或 Pycharm,可以直接使用界面下方的Terminal
pip install pandas
pip install numpy
pip install matplotlib
pip install seaborn
pip install scikit-learn
2.导入相关数据集
本文的数据集是 Data_Train.xlsx,首先看看训练集的格式:
import pandas as pd
import numpy as np
import matplotlib.pyplot as plt
import seaborn as sns
sns.set_style('whitegrid')


flights = pd.read_excel('./Data_Train.xlsx')
flights.head()
可见训练集中的字段有航空公司(Airline)、日期(Date_of_Journey)、始发站(Source)、终点站(Destination)、路线(Route)、起飞时间(Dep_Time)、抵达时间(Arrival_Time)、历经时长(Duration)、总计停留站点个数(Total_Stops)、额外信息(Additional_Info),最后是机票价格(Price)。
与其相对的测试集,除了缺少价格字段之外,与训练集的其他所有字段均一致。
下载完整数据源和代码请访问:
https://pythondict.com/download/predict-ticket/
或在Python实用宝典后台回复:预测机票。
3.探索性数据分析
3.1 清理缺失数据
看看所有字段的基本信息:
flights.info()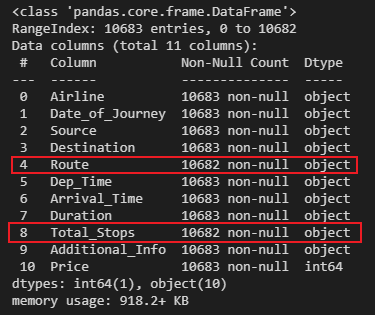
其他的非零值数量均为10683,只有路线和停靠站点数是10682,说明这两个字段缺少了一个值。
谨慎起见,我们删掉缺少数据的行:
# clearing the missing data
flights.dropna(inplace=True)
flights.info()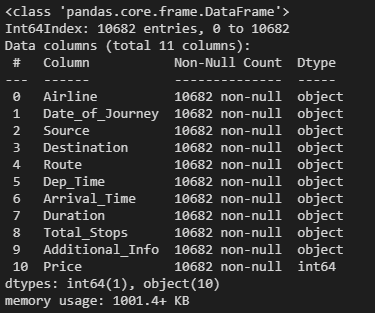
现在非零值达到一致数量,数据清理完毕。
3.2 航班公司分布特征
接下来看看航空公司的分布特征:
sns.countplot('Airline', data=flights)
plt.xticks(rotation=90)
plt.show()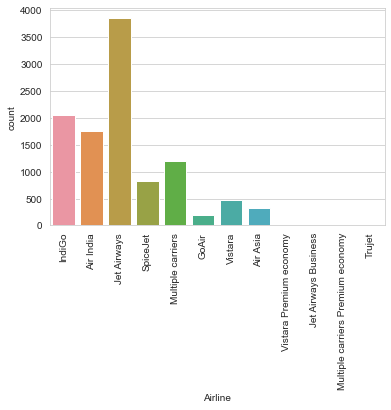
前三名的航空公司分别是 IndiGo, Air India, JetAirways.
其中可能存在廉价航空公司。
3.3 再来看看始发地的分布
sns.countplot('Source',data=flights)
plt.xticks(rotation=90)
plt.show()
某些地区可能是冷门地区,存在冷门机票的可能性比较大。
3.4 停靠站点的数量分布
sns.countplot('Total_Stops',data=flights)
plt.xticks(rotation=90)
plt.show()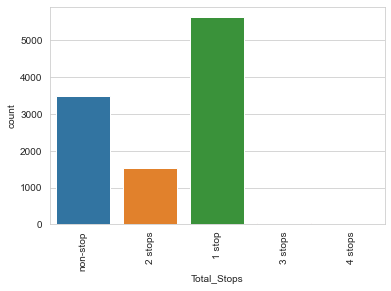
看来大部分航班在飞行途中只停靠一次或无停靠。
会不会某些停靠多的航班比较便宜?
3.5 有多少数据含有额外信息
plot=plt.figure()
sns.countplot('Additional_Info',data=flights)
plt.xticks(rotation=90)
大部分航班信息中都没有包含额外信息,除了部分航班信息有:不包含飞机餐、不包含免费托运。
这个信息挺重要的,是否不包含这两项服务的飞机机票比较便宜?
3.6 时间维度分析
首先转换时间格式:
flights['Date_of_Journey'] = pd.to_datetime(flights['Date_of_Journey'])
flights['Dep_Time'] = pd.to_datetime(flights['Dep_Time'],format='%H:%M:%S').dt.time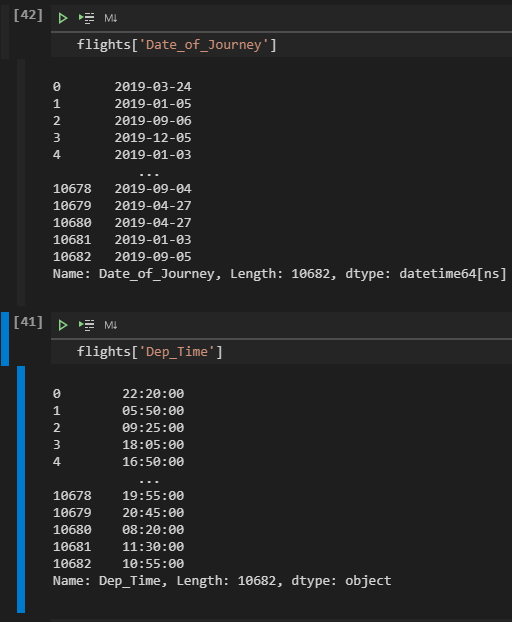
接下来,研究一下出发时间和价格的关系:
flights['weekday'] = flights[['Date_of_Journey']].apply(lambda x:x.dt.day_name())
sns.barplot('weekday','Price',data=flights)
plt.show()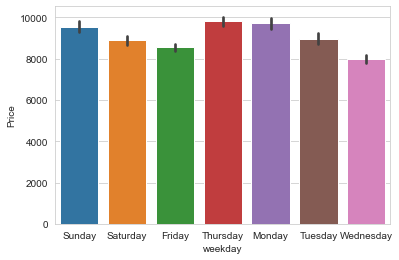
大体上价格没有差别,说明这个特征是无效的。
那么月份和机票价格的关系呢?
flights["month"] = flights['Date_of_Journey'].map(lambda x: x.month_name())
sns.barplot('month','Price',data=flights)
plt.show()
没想到4月的机票价格均价只是其他月份的一半,看来4月份是印度的出行淡季吧。
起飞时间和价格的关系:
flights['Dep_Time'] = flights['Dep_Time'].apply(lambda x:x.hour)
flights['Dep_Time'] = pd.to_numeric(flights['Dep_Time'])
sns.barplot('Dep_Time','Price',data=flights)
plot.show()
可以看到,红眼航班(半夜及早上)的机票比较便宜,这是符合我们的认知的。
3.7 清除无效特征
把那些和价格没有关联关系的字段直接去除掉:
flights.drop(['Route','Arrival_Time','Date_of_Journey'],axis=1,inplace=True)
flights.head()
4.模型训练
接下来,我们可以准备使用模型来预测机票价格了,不过,还需要对数据进行预处理和特征缩放。
4.1 数据预处理
将字符串变量使用数字替代:
from sklearn.preprocessing import LabelEncoder
var_mod = ['Airline','Source','Destination','Additional_Info','Total_Stops','weekday','month','Dep_Time']
le = LabelEncoder()
for i in var_mod:
    flights[i] = le.fit_transform(flights[i])
flights.head()
对每列数据进行特征缩放,提取自变量(x)和因变量(y):
flights.corr()
def outlier(df):
    for i in df.describe().columns:
        Q1=df.describe().at['25%',i]
        Q3=df.describe().at['75%',i]
        IQR= Q3-Q1
        LE=Q1-1.5*IQR
        UE=Q3+1.5*IQR
        df[i]=df[i].mask(df[i]        df[i]=df[i].mask(df[i]>UE,UE)
    return df
flights = outlier(flights)
x = flights.drop('Price',axis=1)
y = flights['Price']
划分测试集和训练集:
from sklearn.model_selection import train_test_split
x_train, x_test, y_train, y_test = train_test_split(x, y, test_size=0.2, random_state=101)
4.2 模型训练及测试
使用随机森林进行模型训练:
from sklearn.ensemble import RandomForestRegressor
rfr=RandomForestRegressor(n_estimators=100)
rfr.fit(x_train,y_train)
在随机森林中,我们有一种根据数据的相关性来确定特征重要性的方法:
features=x.columns
importances = rfr.feature_importances_
indices = np.argsort(importances)
plt.figure(1)
plt.title('Feature Importances')
plt.barh(range(len(indices)), importances[indices], color='b', align='center')
plt.yticks(range(len(indices)), features[indices])
plt.xlabel('Relative Importance')
可以看到,Duration(飞行时长)是影响最大的因子。
对划分的测试集进行预测,得到结果:
predictions=rfr.predict(x_test)
plt.scatter(y_test,predictions)
plt.show()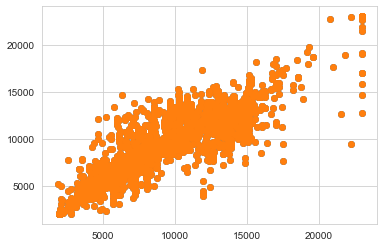
这样看不是很直观,接下来我们要数字化地评价这个模型。
4.3 模型评价
sklearn 提供了非常方便的函数来评价模型,那就是 metrics :
from sklearn import metrics
print('MAE:', metrics.mean_absolute_error(y_test, predictions))
print('MSE:', metrics.mean_squared_error(y_test, predictions))
print('RMSE:', np.sqrt(metrics.mean_squared_error(y_test, predictions)))
print('r2_score:', (metrics.r2_score(y_test, predictions)))
结果:
MAE: 1453.9350628905618
MSE: 4506308.3645551
RMSE: 2122.806718605135
r2_score: 0.7532074710409375
这4个值中你可以只关注R2_score,r2越接近1说明模型效果越好,这个模型的分数是0.75,算是很不错的模型了。
看看其残差直方图是否符合正态分布:
sns.distplot((y_test-predictions),bins=50)
plt.show()
不错,多数预测结果和真实值都在-1000到1000的范围内,算是可以接受的结果。其残差直方图也基本符合正态分布,说明模型是有效果的。
译自kaggle社区,有较多的增删:
https://www.kaggle.com/harikrishna9/how-to-predict-flight-ticket-price/notebook

推荐阅读
在酒店看小电影,他被勒索了1720元,懂点HTTPS真的很有必要!
刚刚用华为鸿蒙跑了个“hello world”!跑通后,我特么开始怀疑人生....
扫码回复「大礼包」后获取大礼
扫码加我微信备注「三剑客」送你上图三本电子书


