Python实现社交网络可视化,看看你的人脉影响力如何
Python的第三方库来进行社交网络的可视化
数据来源
pandas模块读取
数据的读取和清洗
当然我们先导入需要用到的模块
import pandas as pd
import janitor
import datetime

from IPython.core.display import display, HTML
from pyvis import network as net
import networkx as nx
读取所需要用到的数据集
df_ori = pd.read_csv("Connections.csv", skiprows=3)
df_ori.head()
df = (
    df_ori
    .clean_names() # 去除掉字符串中的空格以及大写变成小写
    .drop(columns=['first_name', 'last_name', 'email_address']) # 去除掉这三列
    .dropna(subset=['company', 'position']) # 去除掉company和position这两列当中的空值
    .to_datetime('connected_on', format='%d %b %Y')
  )
output
                    company            position connected_on
0                xxxxxxxxxx  Talent Acquisition   2021-08-15
1               xxxxxxxxxxxx   Associate Partner   2021-08-14
2                      xxxxx                猎头顾问   2021-08-14
3  xxxxxxxxxxxxxxxxxxxxxxxxx          Consultant   2021-07-26
4    xxxxxxxxxxxxxxxxxxxxxx     Account Manager   2021-07-19
数据的分析与可视化
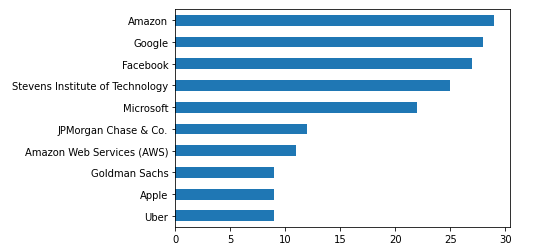
先来看一下小编认识的这些人脉中,分别都是在哪些公司工作的
df['company'].value_counts().head(10).plot(kind="barh").invert_yaxis()
output
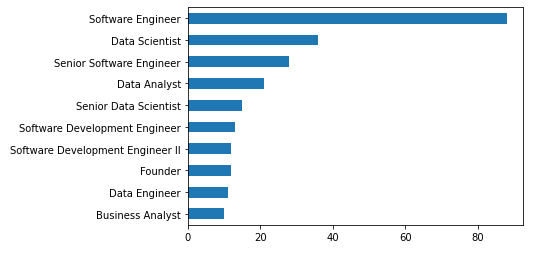
df['position'].value_counts().head(10).plot(kind="barh").invert_yaxis()
output
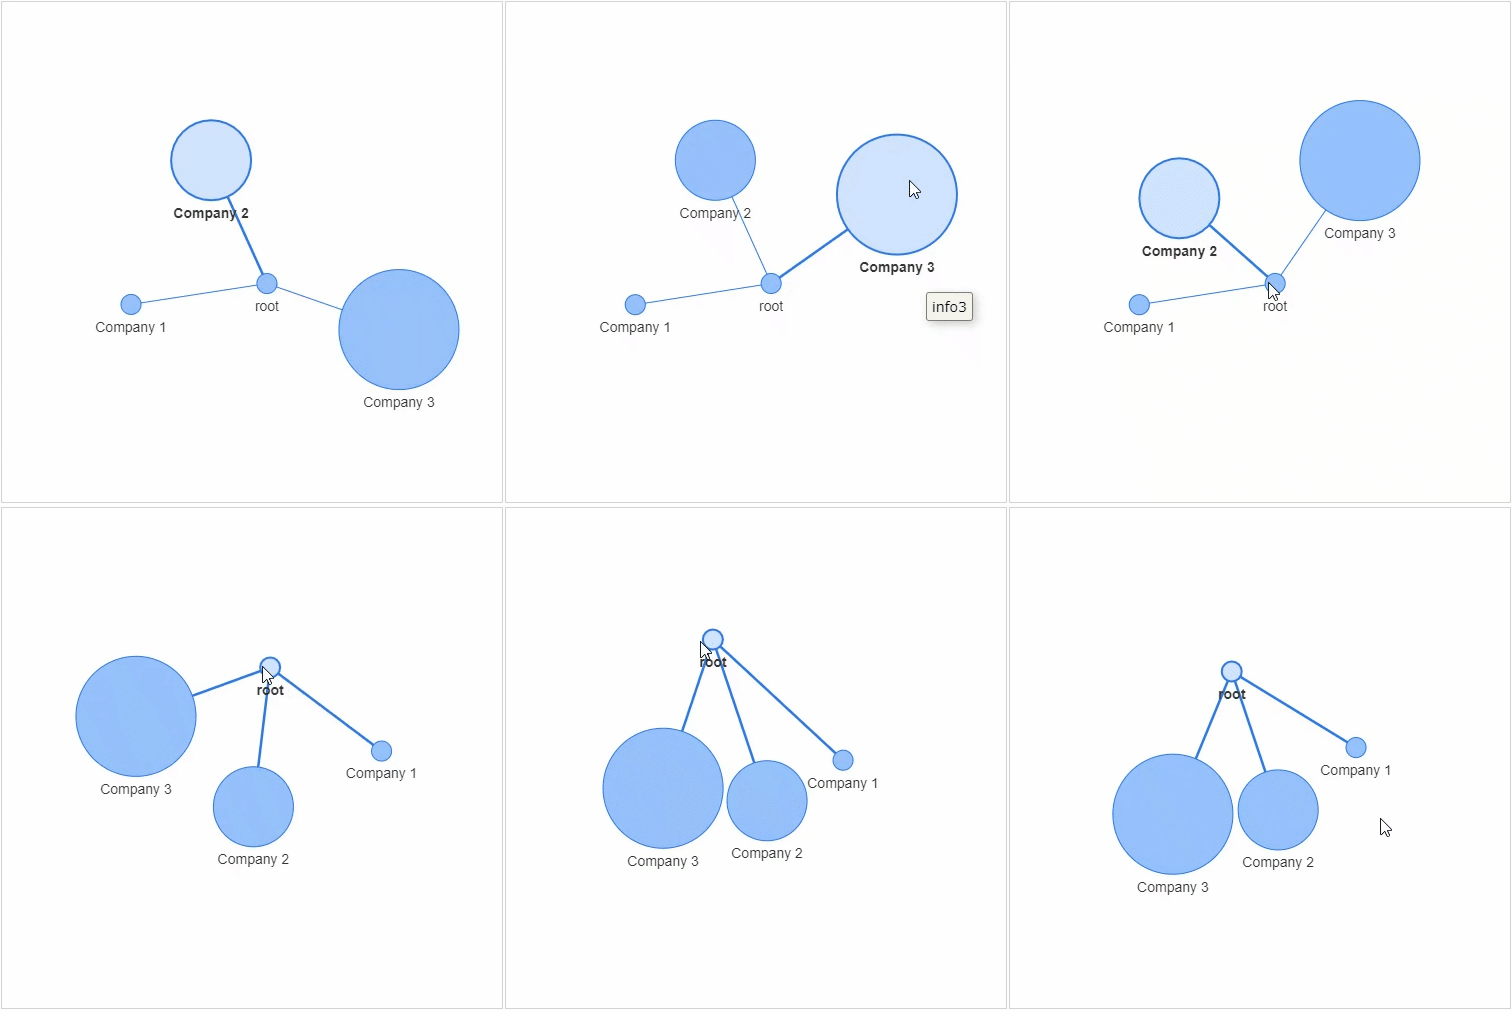
节点:社交网络当中的每个参与者 边缘:代表着每一个参与者的关系以及关系的紧密程度
networkx模块以及pyvis模块,g = nx.Graph()
g.add_node(0, label = "root") # intialize yourself as central node
g.add_node(1, label = "Company 1", size=10, title="info1")
g.add_node(2, label = "Company 2", size=40, title="info2")
g.add_node(3, label = "Company 3", size=60, title="info3")
size代表着节点的大小,然后我们将这些个节点相连接g.add_edge(0, 1)
g.add_edge(0, 2)
g.add_edge(0, 3)
df_company = df['company'].value_counts().reset_index()
df_company.columns = ['company', 'count']
df_company = df_company.sort_values(by="count", ascending=False)
df_company.head(10)
output
                            company  count
0                            Amazon     xx
1                            Google     xx
2                          Facebook     xx
3   Stevens Institute of Technology     xx
4                         Microsoft     xx
5              JPMorgan Chase & Co.     xx
6         Amazon Web Services (AWS)     xx
9                             Apple      x
10                    Goldman Sachs      x
8                            Oracle      x
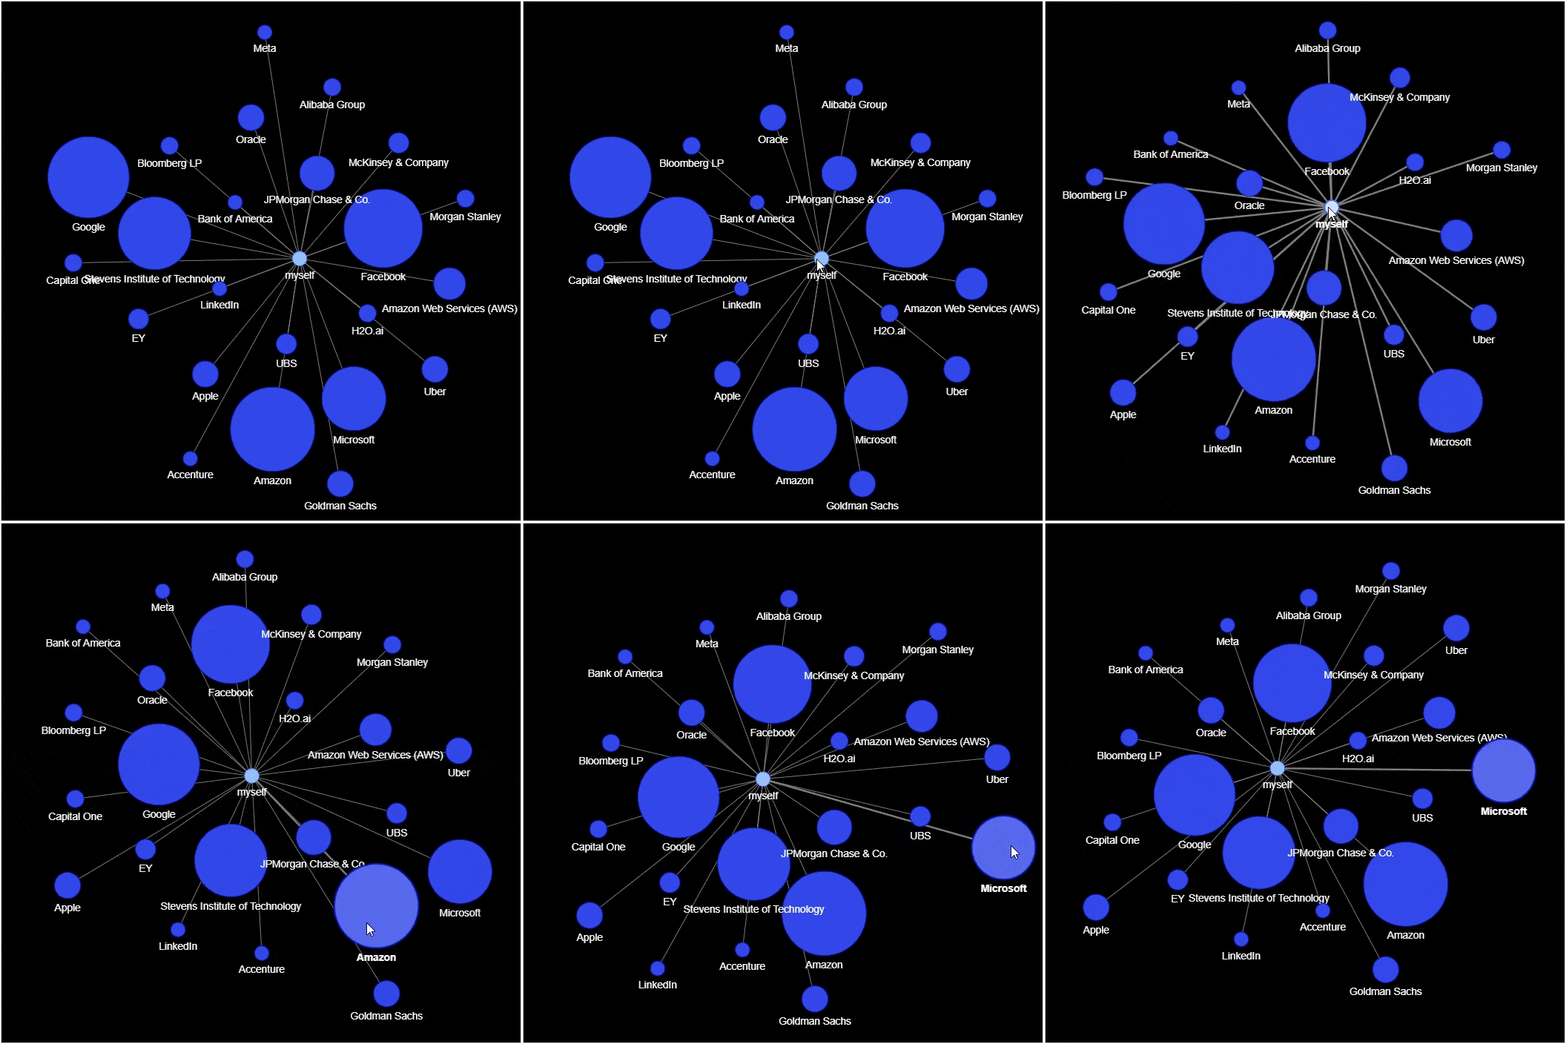
然后我们来绘制社交网络的图表
# 实例化网络
g = nx.Graph()
g.add_node('myself') # 将自己放置在网络的中心
# 遍历数据集当中的每一行
for _, row in df_company_reduced.iterrows():
# 将公司名和统计结果赋值给新的变量
company = row['company']
count = row['count']
title = f"{company} – {count}"
positions = set([x for x in df[company == df['company']]['position']])
positions = ''.join('{} '.format(x) for x in positions)
position_list = f"{positions}
"
hover_info = title + position_list
g.add_node(company, size=count*2, title=hover_info, color='#3449eb')
g.add_edge('root', company, color='grey')
# 生成网络图表
nt = net.Network(height='700px', width='700px', bgcolor="black", font_color='white')
nt.from_nx(g)
nt.hrepulsion()
nt.show('company_graph.html')
display(HTML('company_graph.html'))
output
df_position = df['position'].value_counts().reset_index()
df_position.columns = ['position', 'count']
df_position = df_position.sort_values(by="count", ascending=False)
df_position.head(10)
output
                           position  count
0                 Software Engineer     xx
1                    Data Scientist     xx
2          Senior Software Engineer     xx
3                      Data Analyst     xx
4             Senior Data Scientist     xx
5     Software Development Engineer     xx
6  Software Development Engineer II     xx
7                           Founder     xx
8                     Data Engineer     xx
9                  Business Analyst     xx
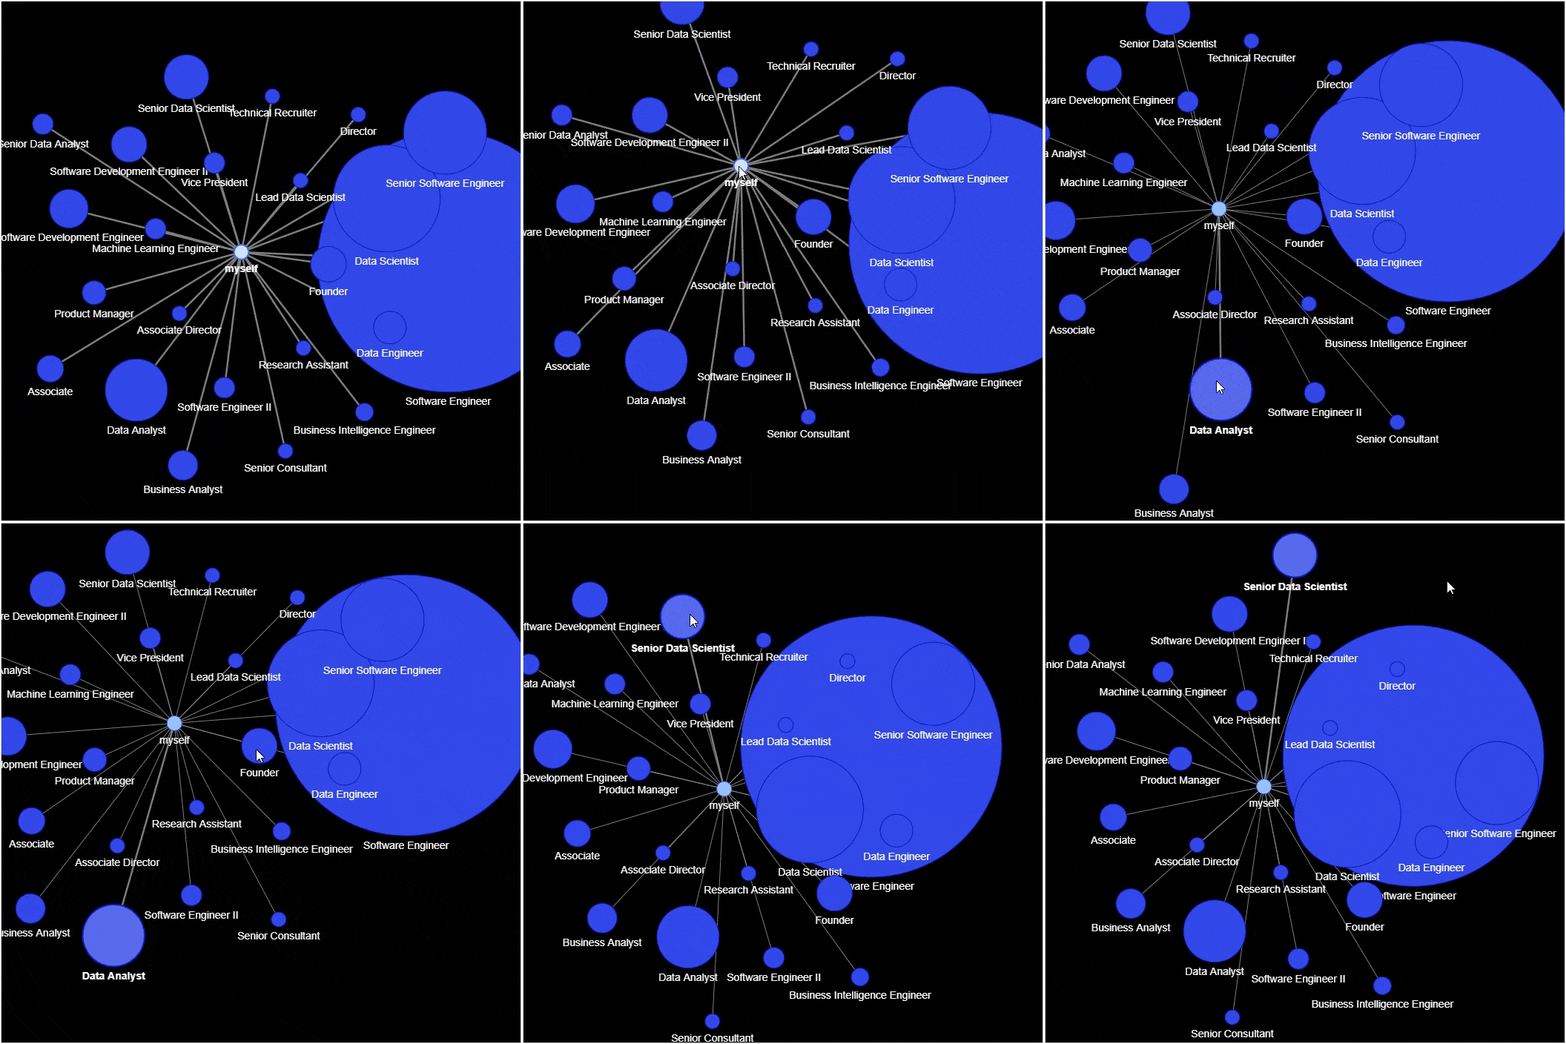
然后进行网络图的绘制
g = nx.Graph()
g.add_node('myself') # 将自己放置在网络的中心
for _, row in df_position_reduced.iterrows():
# 将岗位名和统计结果赋值给新的变量
position = row['position']
count = row['count']
title = f"{position} – {count}"
positions = set([x for x in df[position == df['position']]['position']])
positions = ''.join('{} '.format(x) for x in positions)
position_list = f"{positions}
"
hover_info = title + position_list
g.add_node(position, size=count*2, title=hover_info, color='#3449eb')
g.add_edge('root', position, color='grey')
# 生成网络图表
nt = net.Network(height='700px', width='700px', bgcolor="black", font_color='white')
nt.from_nx(g)
nt.hrepulsion()
nt.show('position_graph.html')
output
各位伙伴们好,詹帅本帅搭建了一个个人博客和小程序,汇集各种干货和资源,也方便大家阅读,感兴趣的小伙伴请移步小程序体验一下哦!(欢迎提建议)
推荐阅读
评论

