
VScode数据结构可视化神器!
↓↓↓点击关注,回复资料,10个G的惊喜
【导读】VSCode Debug Visualizer是VSCode扩展,可在编辑器中可视化数据结构。这对于在调试期间可视化监视的值很有用。该扩展名有助于可视化图,表,数组,直方图和树。
扩展链接:
https://marketplace.visualstudio.com/items?itemName=hediet.debug-visualizer
原文链接:
https://addyosmani.com/blog/visualize-data-structures-vscode/
官方样例
VSCode Debug Visualizer的JavaScript示例包含在主存储库中。要开始使用它们,请检查是否已安装yarn和node,然后:
复制下列仓库代码:
https://github.com/hediet/vscode-debug-visualizer
运行yarn,安装依赖包
在VScode 中打开仓库,并标记Debug点
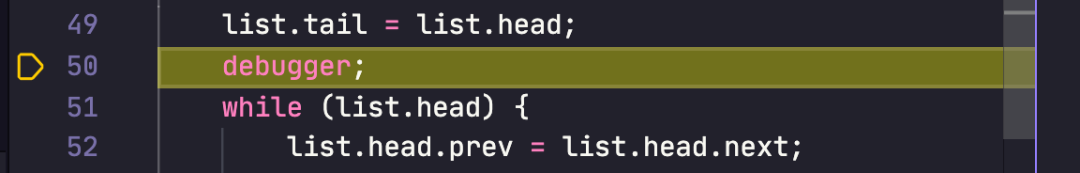
开始debug
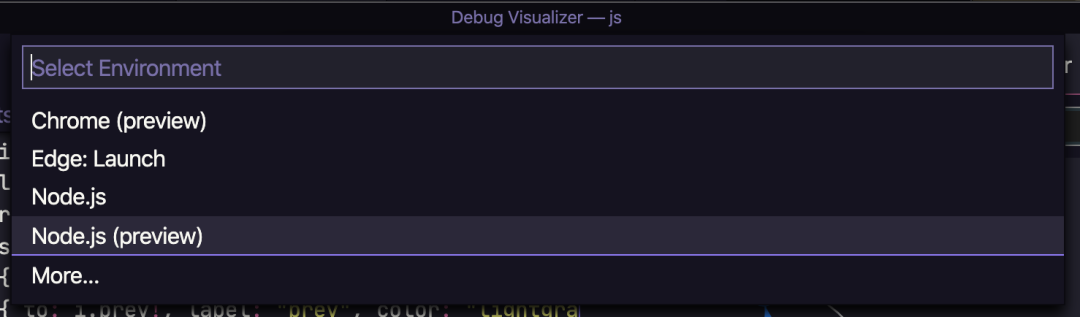
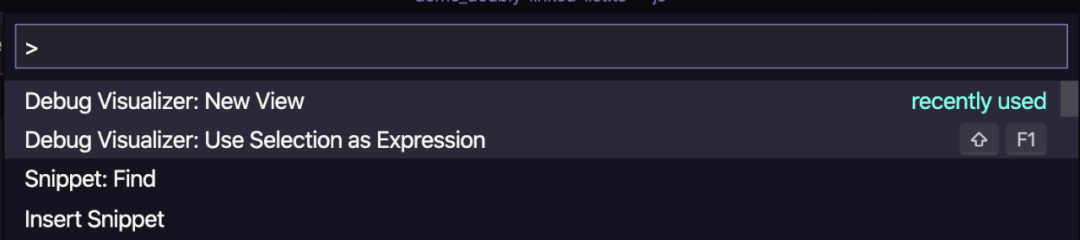
选择可视化工具
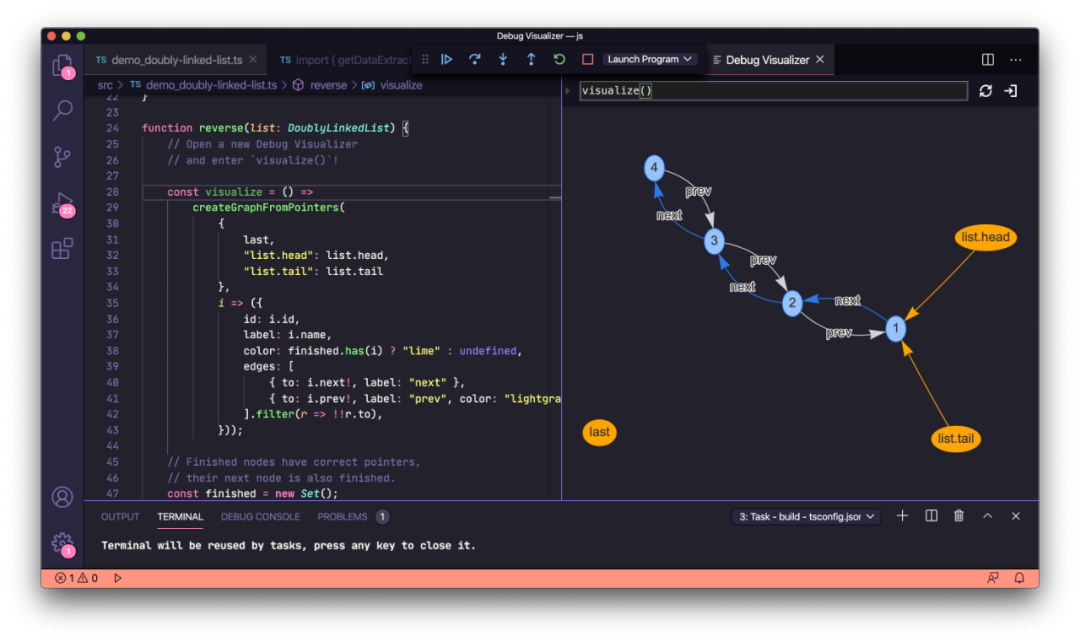
即可显示可视结果
更多可视化例子
数组
const range = [1, 2, 33, 31, 1, 2, 63, 943, 346, 24, 123, 6, 32];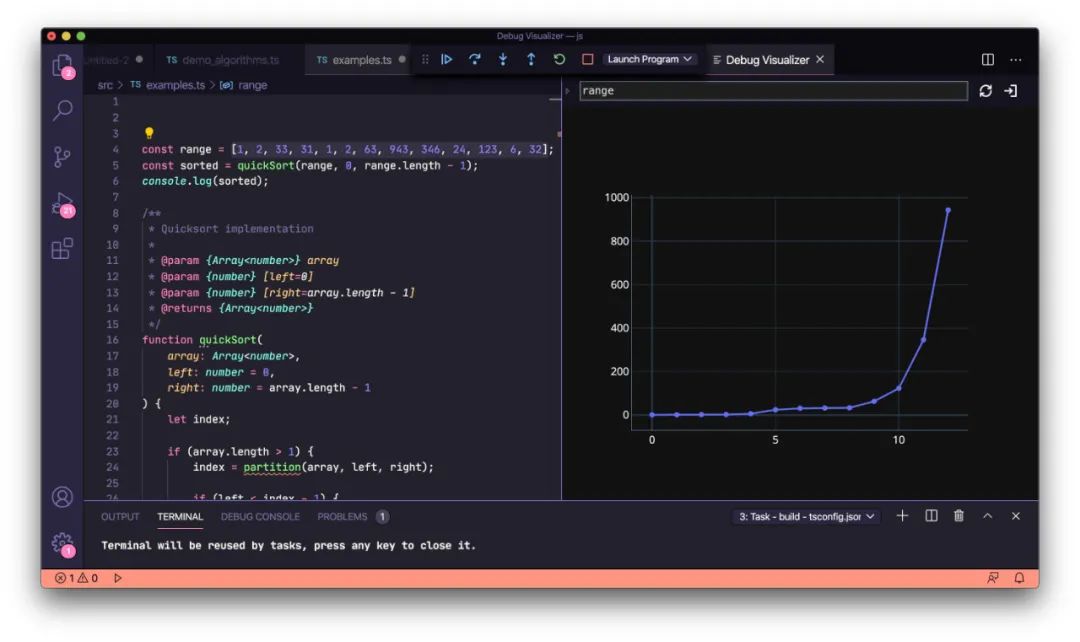
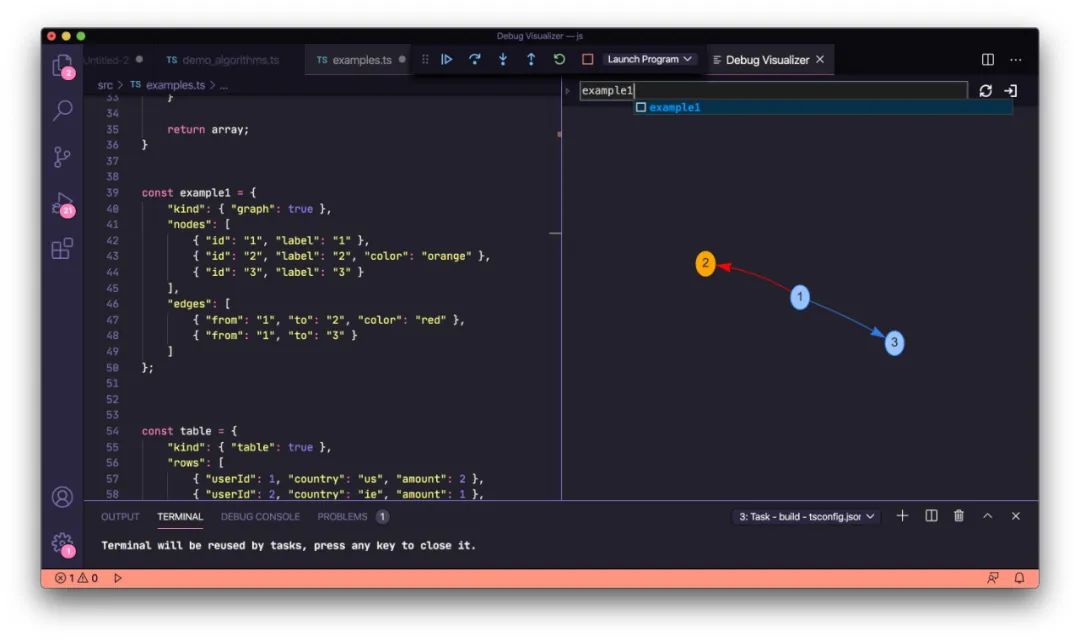
const example1 = {"kind": { "graph": true },"nodes": [{ "id": "1", "label": "1" },{ "id": "2", "label": "2", "color": "orange" },{ "id": "3", "label": "3" }],"edges": [{ "from": "1", "to": "2", "color": "red" },{ "from": "1", "to": "3" }]};
图
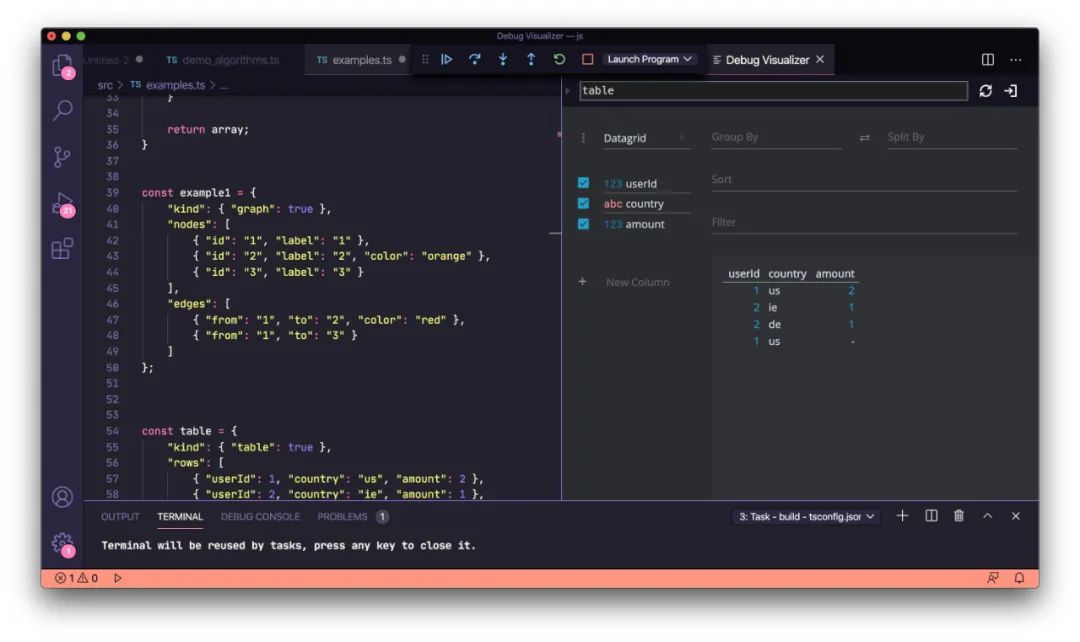
表格
const table = {"kind": { "table": true },"rows": [{ "userId": 1, "country": "us", "amount": 2 },{ "userId": 2, "country": "ie", "amount": 1 },{ "userId": 2, "country": "de", "amount": 1 },{ "userId": 1, "country": "us" }]};
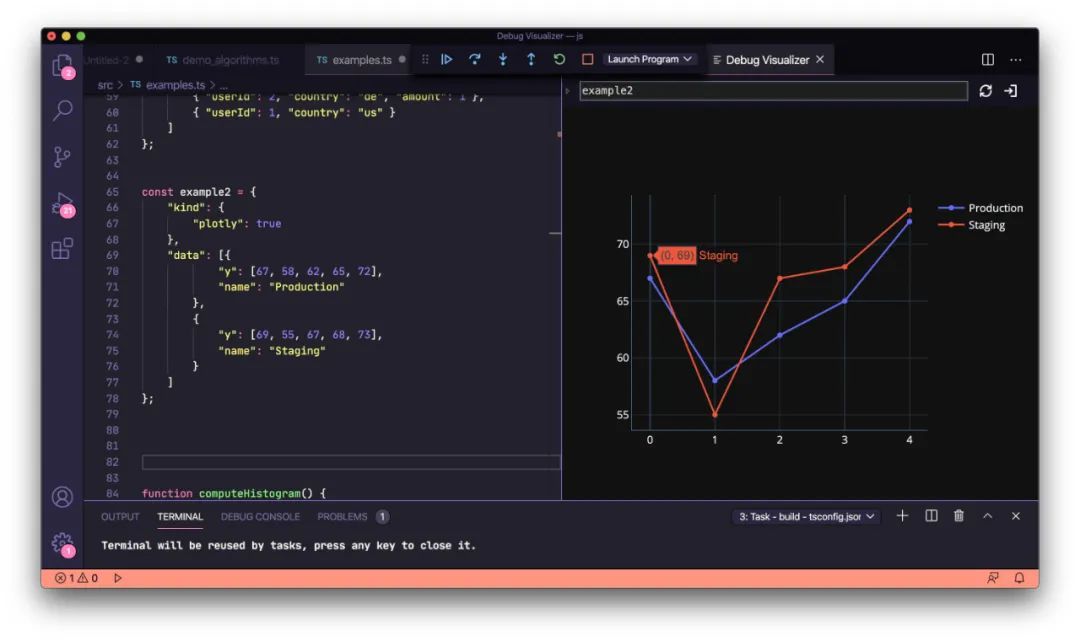
曲线图
const example2 = {"kind": {"plotly": true},"data": [{"y": [67, 58, 62, 65, 72],"name": "Production"},{"y": [69, 55, 67, 68, 73],"name": "Staging"}]};

评论