分享一个趣味性十足的Python可视化技巧
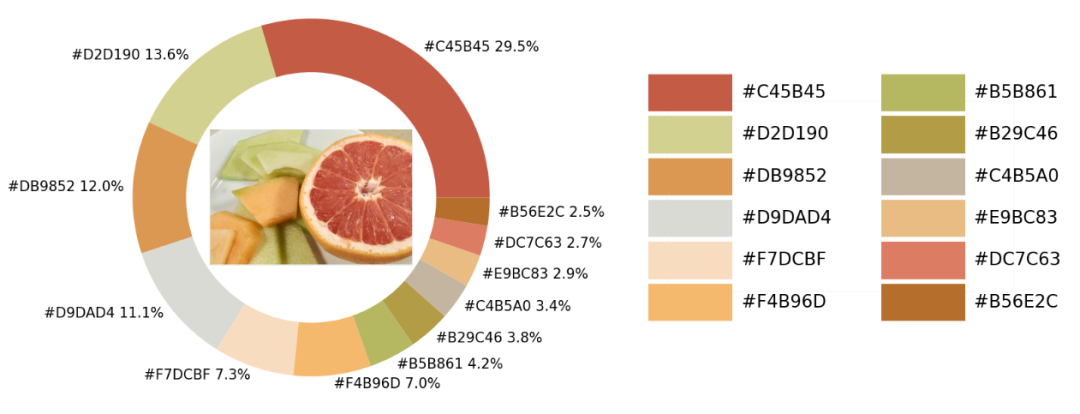
Python中的可视化模块以及opencv模块来识别出图片当中所有的颜色要素,并且将其添加到可视化图表的配色当中导入模块并加载图片
matplotlib模块,我们将图片中的颜色抽取出来之后会保存在颜色映射表中,所以要使用到colormap模块,同样也需要导入进来import numpy as np
import pandas as pd
import matplotlib.pyplot as plt
import matplotlib.patches as patches
import matplotlib.image as mpimg
from PIL import Image
from matplotlib.offsetbox import OffsetImage, AnnotationBbox
import cv2
import extcolors
from colormap import rgb2hex
input_name = 'test_1.png'
img = plt.imread(input_name)
plt.imshow(img)
plt.axis('off')
plt.show()

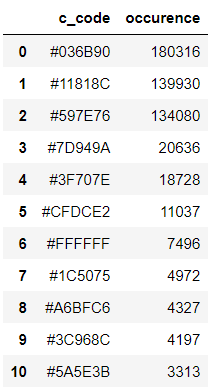
提取颜色并整合成表格
extcolors模块来从图片中提取颜色,输出的结果是RGB形式呈现出来的颜色,代码如下colors_x = extcolors.extract_from_path(img_url, tolerance=12, limit = 12)
colors_x
([((3, 107, 144), 180316),
  ((17, 129, 140), 139930),
  ((89, 126, 118), 134080),
  ((125, 148, 154), 20636),
  ((63, 112, 126), 18728),
  ((207, 220, 226), 11037),
  ((255, 255, 255), 7496),
  ((28, 80, 117), 4972),
  ((166, 191, 198), 4327),
  ((60, 150, 140), 4197),
  ((90, 94, 59), 3313),
  ((56, 66, 39), 1669)],
 538200)
DataFrame数据集,代码如下def color_to_df(input_color):
colors_pre_list = str(input_color).replace('([(', '').split(', (')[0:-1]
df_rgb = [i.split('), ')[0] + ')' for i in colors_pre_list]
df_percent = [i.split('), ')[1].replace(')', '') for i in colors_pre_list]
# 将RGB转换成十六进制的颜色
df_color_up = [rgb2hex(int(i.split(", ")[0].replace("(", "")),
int(i.split(", ")[1]),
int(i.split(", ")[2].replace(")", ""))) for i in df_rgb]
df = pd.DataFrame(zip(df_color_up, df_percent), columns=['c_code', 'occurence'])
return df
DataFrame数据集当中df_color = color_to_df(colors_x)
df_color
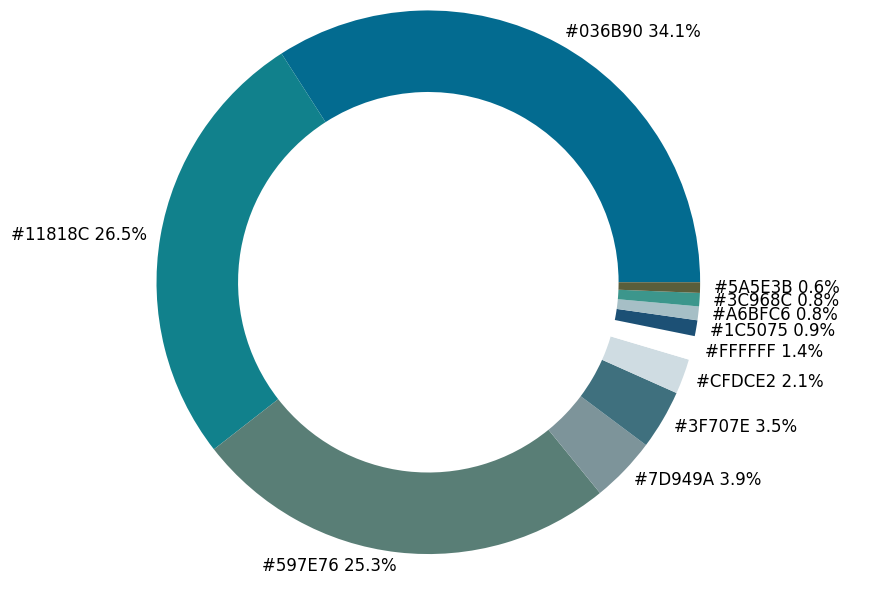
绘制图表
matplotlib模块,代码如下fig, ax = plt.subplots(figsize=(90,90),dpi=10)
wedges, text = ax.pie(list_precent,
labels= text_c,
labeldistance= 1.05,
colors = list_color,
textprops={'fontsize': 120, 'color':'black'}
)
plt.setp(wedges, width=0.3)
ax.set_aspect("equal")
fig.set_facecolor('white')
plt.show()
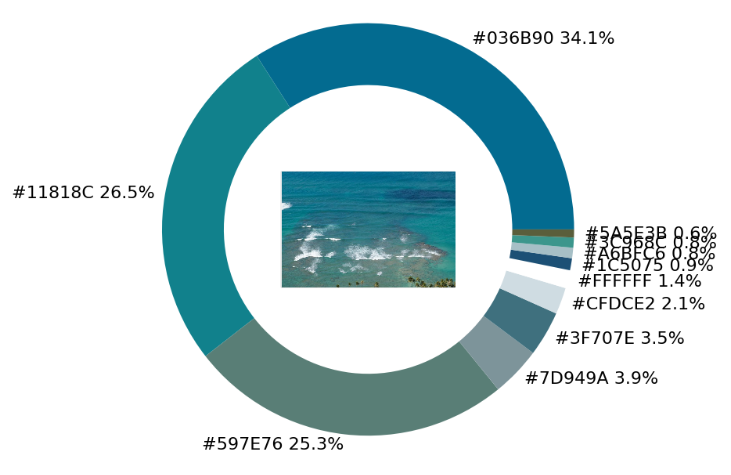
imagebox = OffsetImage(img, zoom=2.3)
ab = AnnotationBbox(imagebox, (0, 0))
ax1.add_artist(ab)
## 调色盘
x_posi, y_posi, y_posi2 = 160, -170, -170
for c in list_color:
    if list_color.index(c) <= 5:
        y_posi += 180
        rect = patches.Rectangle((x_posi, y_posi), 360, 160, facecolor = c)
        ax2.add_patch(rect)
        ax2.text(x = x_posi+400, y = y_posi+100, s = c, fontdict={'fontsize': 190})
    else:
        y_posi2 += 180
        rect = patches.Rectangle((x_posi + 1000, y_posi2), 360, 160, facecolor = c)
        ax2.add_artist(rect)
        ax2.text(x = x_posi+1400, y = y_posi2+100, s = c, fontdict={'fontsize': 190})

ax2.axis('off')
fig.set_facecolor('white')
plt.imshow(bg)
plt.tight_layout()
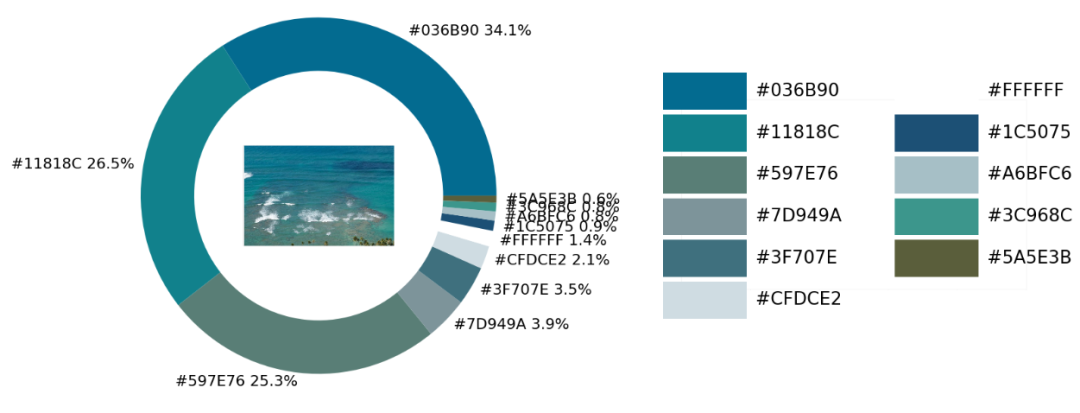
实战环节
def exact_color(input_image, resize, tolerance, zoom):

    output_width = resize
    img = Image.open(input_image)
    if img.size[0] >= resize:
        wpercent = (output_width/float(img.size[0]))
        hsize = int((float(img.size[1])*float(wpercent)))
        img = img.resize((output_width,hsize), Image.ANTIALIAS)
        resize_name = 'resize_'+ input_image
        img.save(resize_name)
    else:
        resize_name = input_image

    fig.set_facecolor('white')
    ax2.axis('off')
    bg = plt.imread('bg.png')
    plt.imshow(bg)
    plt.tight_layout()
    return plt.show()

exact_color('test_2.png', 900, 12, 2.5)

END
推荐阅读
吴恩达deeplearining.ai的经典总结资料
Ps:从小程序直接获取下载
评论
